
Figure 6.
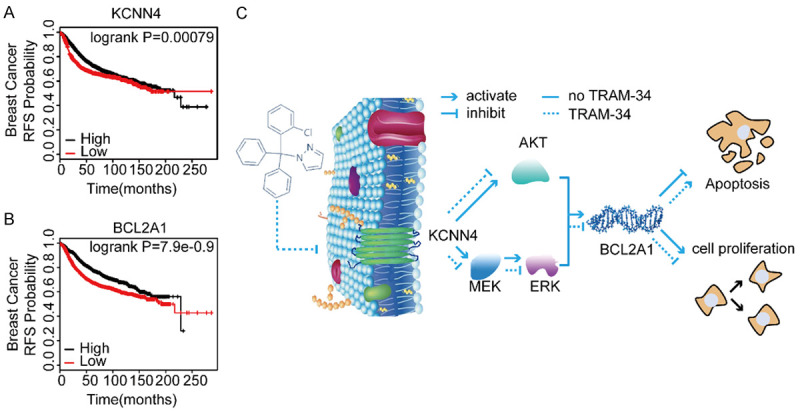
KCNN4 and BCL2A1 indicated a poor prognosis in cancers. A, B. Kaplan-Meier analysis of the relationship between KCNN4 or BCL2A1 and RFS using the Kaplan-Meier plotter database of breast cancer. C. A model depicting the role of KCNN4 upregulation in modulating breast cancer cell response to chemotherapy. In Kaplan-Meier plots, the P values refer to log-rank test results. Experiments were performed in triplicate, and representative results are shown.