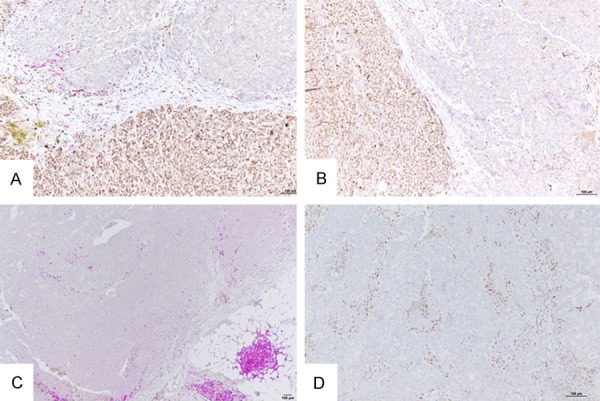
Figure 5.

Representative examples showing spatial relationship between Zeb1+ cells and CD20+ or FoxP3+ TILs in triple-negative breast cancers (double IHC; brown, Zeb1; purple, CD8). A. Tumor with Zeb1+ cells and low density of intratumoral CD20+ TILs. B. Tumor with no Zeb1+ tumor cells and low density of intratumoral CD20+ TILs. C. Tumor with Zeb1+ tumor cells and with low density of intratumoral FoxP3+ TILs. D. Tumor with no Zeb1+ tumor cells, high density of stromal Zeb1+ cells and low density of intratumoral or stromal FoxP3+ TILs. Bar =100 µm.
