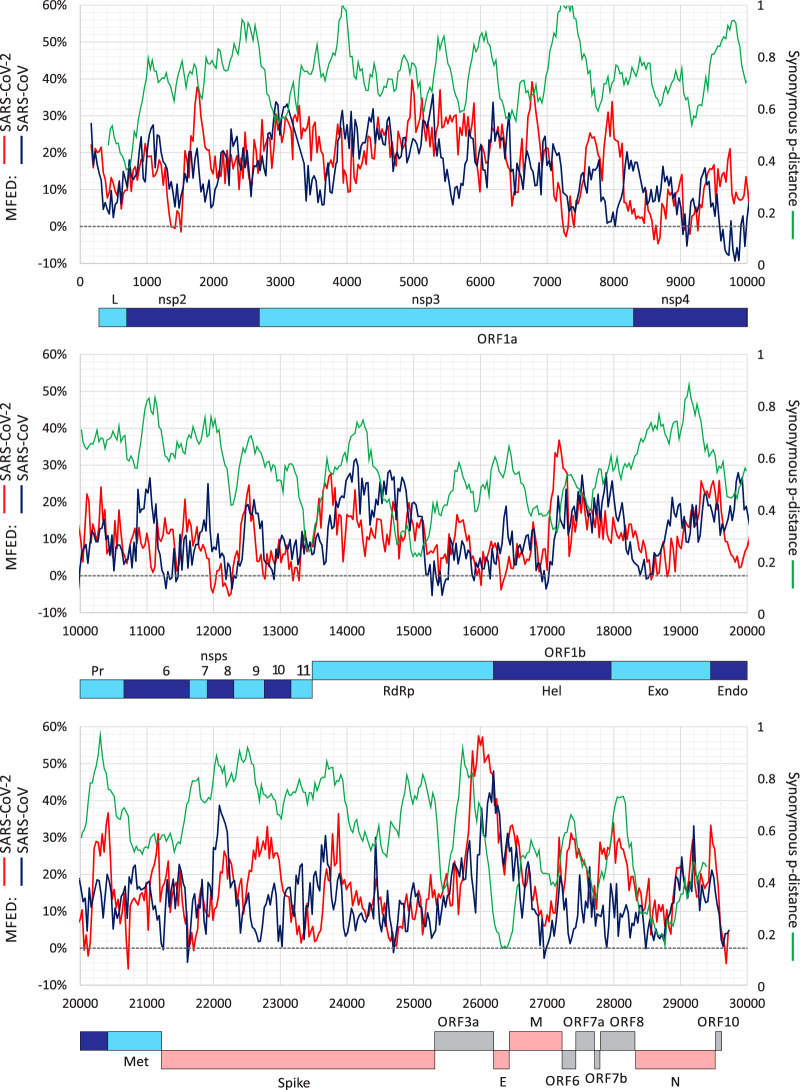
FIG 2.
Genome scan of folding energies and synonymous variability. Windowed MFED values of SARS-CoV-2 and SARS-CoV across the genome (left y axis) using a fragment size of 350 bases incrementing by 30 bases between fragments. A windowed scan of synonymous p-distances (sequential 300-base fragments incrementing by 30 bases between fragments) of aligned concatenated coding region sequences between SARS-CoV-2 and SARS-CoV is superimposed. A genome diagram of SARS-CoV-2 is drawn to scale under each graph. A listing of the sequences analyzed in provided in Table S3.

