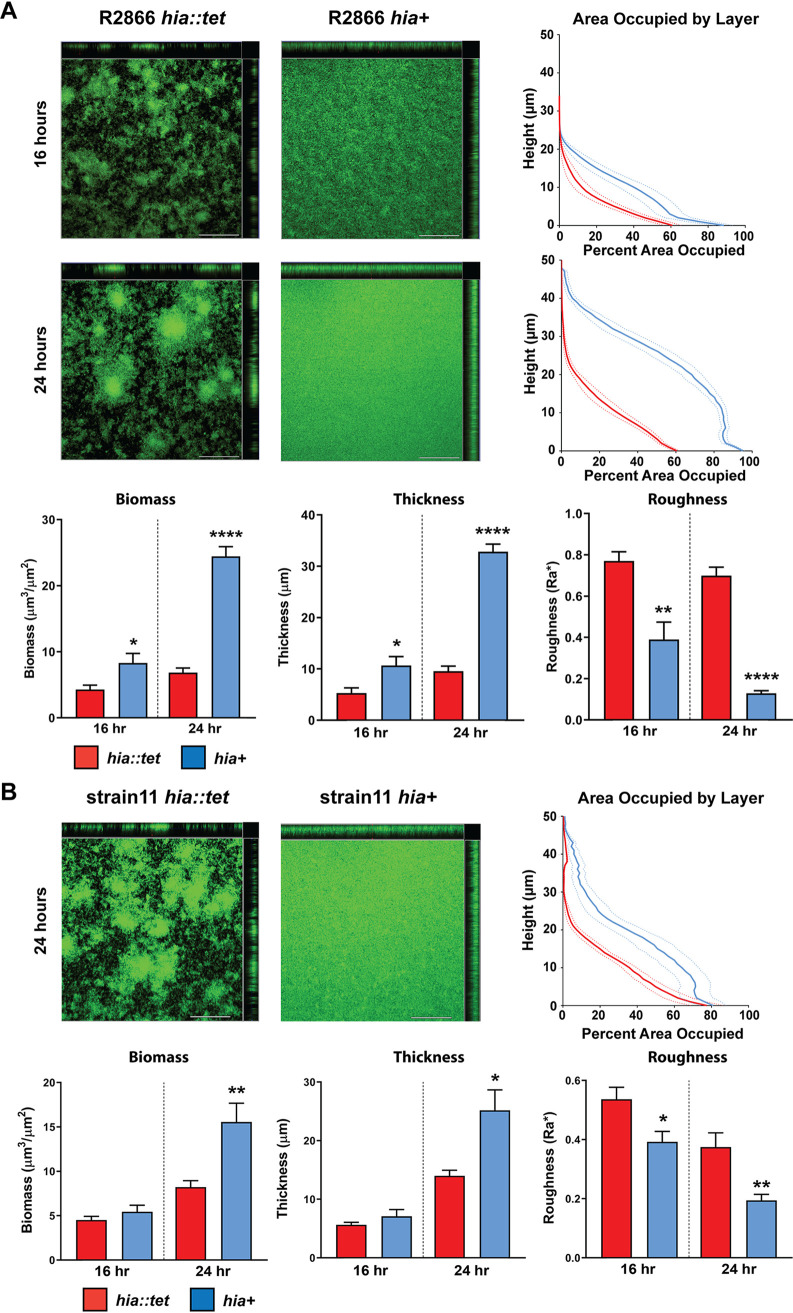
FIG 4.
Biofilm formation by NTHi strains R2866 and strain 11. Representative orthogonal image renderings of biofilm formation by NTHi strain R2866 and strain 11 hia::tet and hia+ biofilms. Bars, 100 μm. Biomass, average thickness, and roughness of hia::tet and hia+ biofilms grown for 16 or 24 h were analyzed by COMSTAT2, and values are shown as mean ± standard error of the mean. *, P < 0.05, **, P < 0.01, ****, P < 0.0001; one-way ANOVA with Dunnett’s post hoc test. Average percent area occupied by bacteria at each individual 1-μm optical section (“layer”) were determined with COMSTAT2. Dashed lines indicate standard error of the mean.

