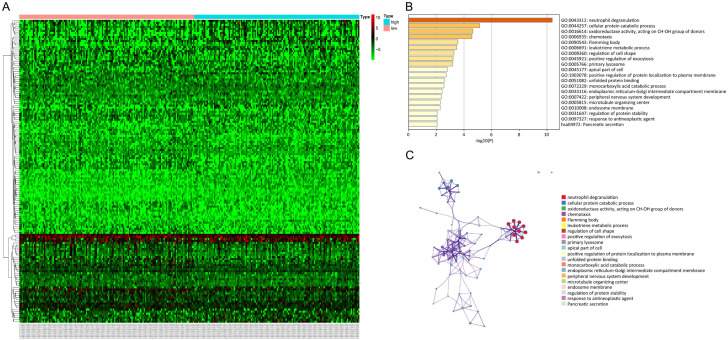
Figure 3.
Comparison of the gene expression profiles between the low and high TMB group. A. Using cut-off values of |log FC| > 1 and P < 0.05, a total of 150 DEGs were identified. The Heatmap depicts the expression of the DEGs in the two groups. Each column indicates the expression level of a specific DEG, while each row indicates a sample. B, C. Functional enrichment analysis of the 150 DEGs using the Genemania platform. The top 20 GO terms and pathways are shown. DEGs, differentially expressed genes; TMB, tumor mutation burden; GO, Gene Ontology.

