Figure 3.
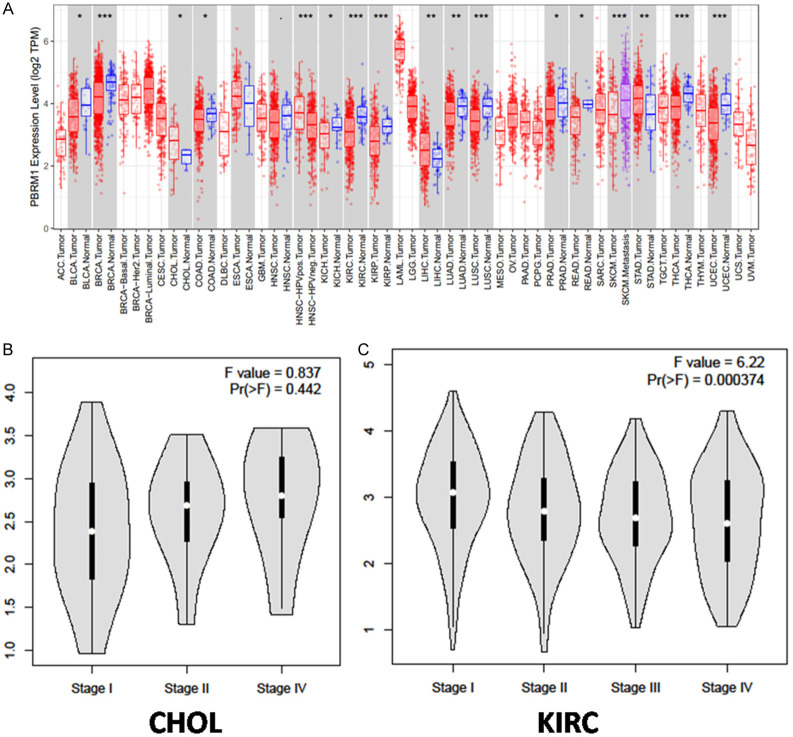
Differential expression of PBRM1 in various tumors and in different CHOL stages (A) PBRM1 expression levels in different tumors from TCGA database were determined by TIMER (*P < 0.05, **P < 0.01, ***P < 0.001). (B) the expression of PBRM1 in different clinical stages in CHOL (C) the expression of PBRM1 in different clinical stages in KIRC.

