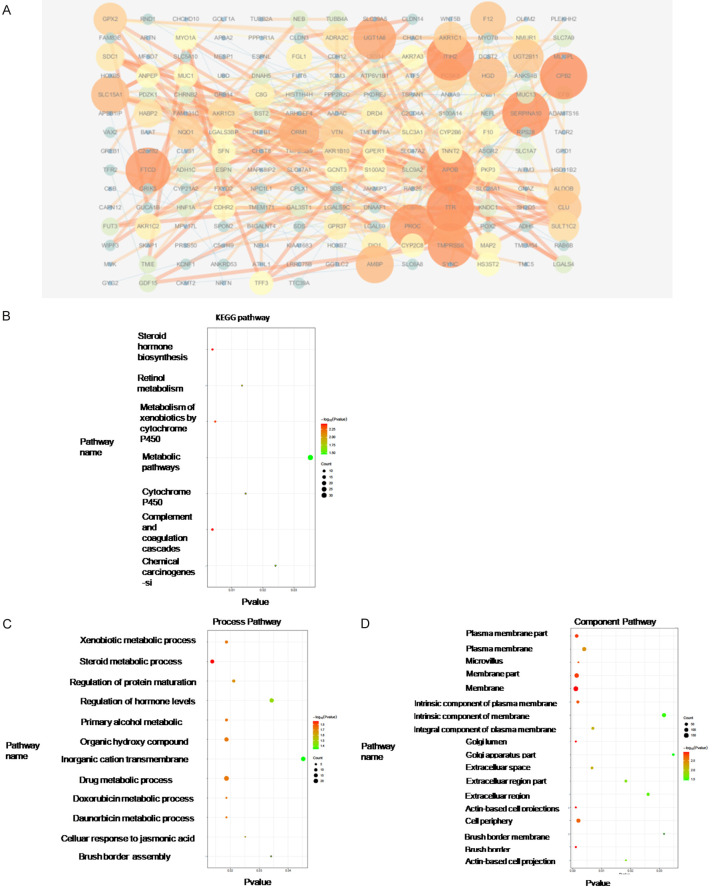
Figure 7.
PPI analysis and GO and KEGG pathway analysis of dysregulated genes from high-expression group of the mutation group in CHOL. Protein-protein interaction network of top 200 up-regulated genes was constructed using STRING v10.0, and visualized by Cytoscape v3.4.0 (A). GO and KEGG Pathway enrichment analysis was analyzed using STRING v10.0 and was visualized by ggplot2 R packages (B-D).

