
Figure 1.
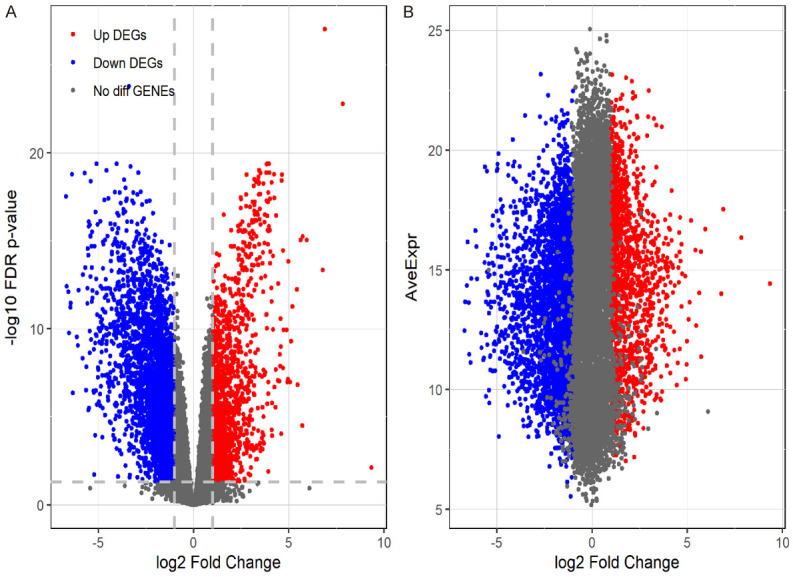
Volcano plot. By analysing data for HR(+)/HER2(-) BC in AYAs and para-carcinoma tissues, we screened a total of 1671 DEGs. DEGs were defined as P < 0.01 and |logFC| > 2.
Official websites use .gov
A
.gov website belongs to an official
government organization in the United States.
Secure .gov websites use HTTPS
A lock (
) or https:// means you've safely
connected to the .gov website. Share sensitive
information only on official, secure websites.
Volcano plot. By analysing data for HR(+)/HER2(-) BC in AYAs and para-carcinoma tissues, we screened a total of 1671 DEGs. DEGs were defined as P < 0.01 and |logFC| > 2.