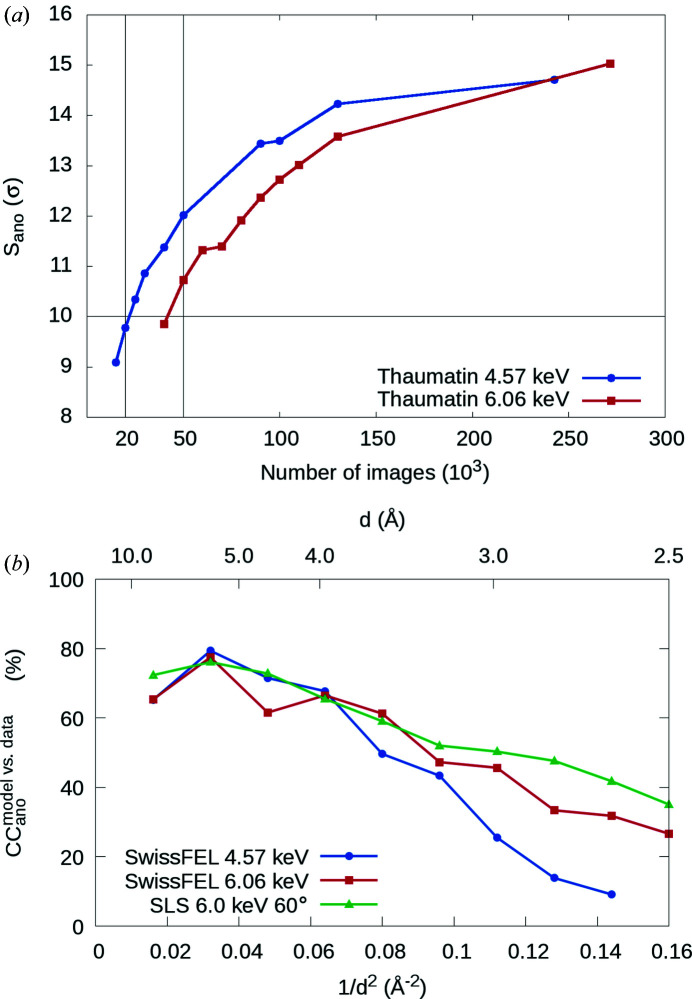
Figure 1.
Anomalous data-quality indicators. (a) Anomalous signal strength (S ano) of thaumatin 4.57 and 6.06 keV data sets for different numbers of indexed diffraction images. The horizontal line indicates an S ano value of 10, below which SAD phasing is difficult. The two vertical lines indicate the minimal numbers of indexed images required for structure determination using native-SAD in this study. (b) Correlation coefficient between the measured and calculated anomalous difference structure-factor amplitudes (CCano model versus data) for thaumatin data sets with minimal amount of data necessary for successful structure solution using native-SAD at the SwissFEL and the Swiss Light Source (SLS) (Leonarski et al., 2018 ▸).

