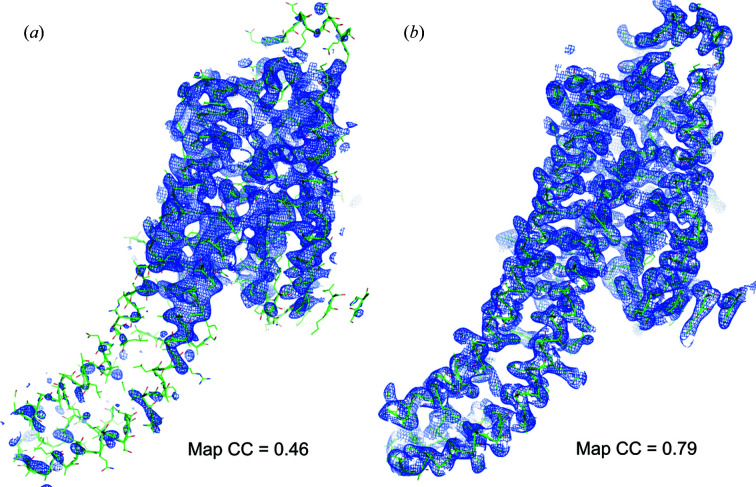
Figure 4.
Phasing and automatic model building. (a) The experimental electron-density map (contoured at 1.0σ) after phasing and density modification obtained from the A2A data set with a minimal number of indexed images (50 000) at 4.57 keV superposed with the A2A molecule after automatic model building and refinement. (b) The 2mF o − DF c electron-density map after automatic model building and refinement. The MapCC values indicate the correlation coefficient between the map shown in the figure and the final refined map.

