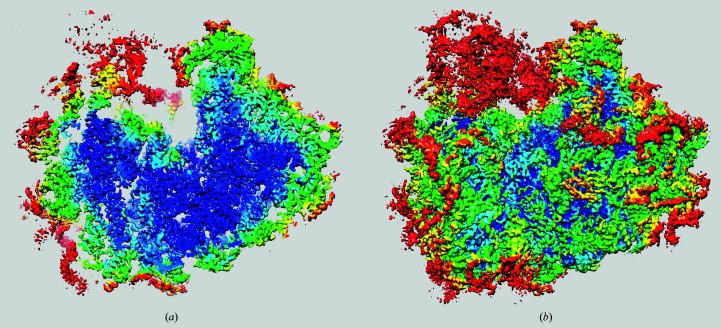
Figure 6.
Local resolution map of the 80S ribosome. (a) Side view: left, 40S subunit; right, 60S subunit. (b) Central section of the resolution map in the orientation shown in (a). The resolution is color coded as follows: red, 3.69 Å; yellow, 3.57 Å; green, 3.35 Å; light blue, 3.15 Å; dark blue, 2.98 Å.

