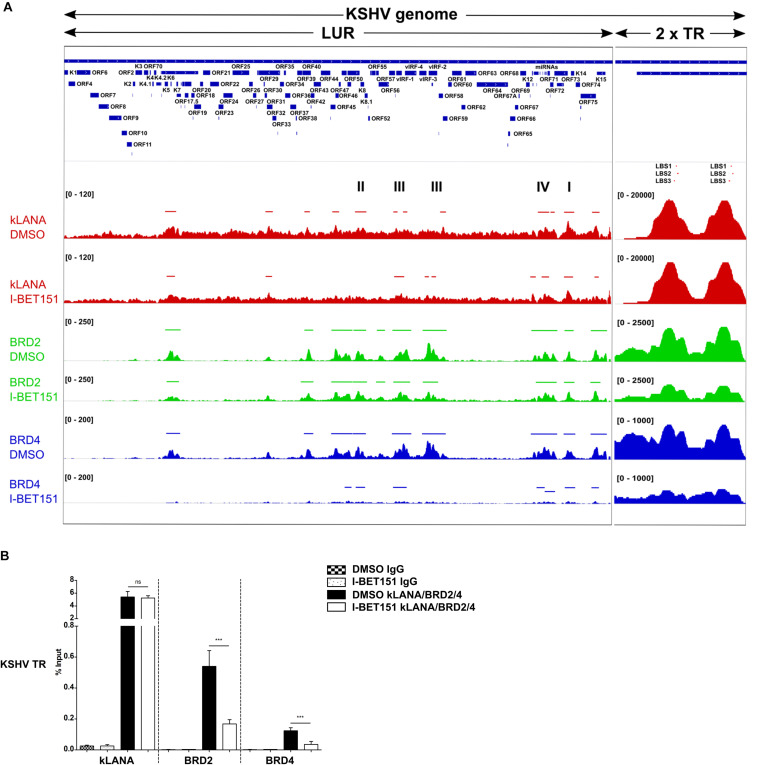
FIGURE 1.
Association of kLANA, Brd2 and Brd4 with the viral genome. (A) ChIP-Seq for kLANA, Brd2 and Brd4 was performed in BCBL-1 cells treated or not with 0.5 μM I-BET151 for 48 h. Sequencing reads obtained were aligned to the KSHV genome (HQ404500 sequence) appended with two copies of the TR. Top: Diagram of the KSHV genome. Bottom: Deposition of kLANA, Brd2 and Brd4 on the KSHV genome in the presence or absence (DMSO) of I-BET151. Horizontal colored bars above the ChIP-Seq diagrams indicate peaks of kLANA, Brd2, and Brd4 deposition. I, latency control region; II, lytic control region; III, vIRF3; IV, miRNA region. The values in square brackets represent the number of extended reads. (B) ChIP-qPCR for kLANA, Brd2 and Brd4 in the presence or absence of I-BET151. PCR primer pair used here target the terminal repeat (TR) subunit near LBS1-3. Bars represent mean ± SD. ***p < 0.001.

