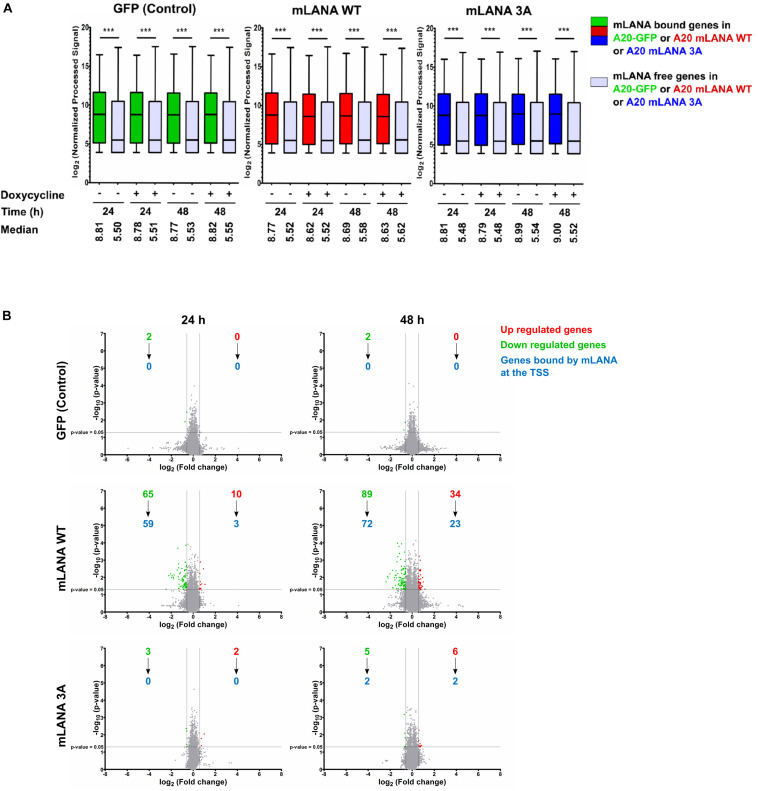
FIGURE 6.
mLANA-mediated cellular transcriptional regulation. (A) Box plots of gene expression microarray signals for cellular genes in mLANA WT-, mLANA 3A-, or GFP-expressing A20 cells. The panel shows a comparison of expression levels for cellular genes, whose TSS are occupied by mLANA or not. Red boxes indicate cellular genes, whose TSS are occupied by mLANA in mLANA WT expressing cells, green boxes indicate the same genes in the A20-GFP control cells and blue boxes the same genes in mLANA-3A expressing cells. Gray boxes indicate genes not bound by mLANA. Boxes represent interquartile range with Min-Max whiskers. ***p < 0.001. (B) Volcano plots for differential regulation of all cellular genes by mLANA WT vs. mLANA 3A for two time points after induction of mLANA expression by doxycycline. Values or dots in green or red represent downregulated and upregulated genes, respectively, gray dots genes that are not differentially regulated. Blue numbers indicate cellular genes, whose TSS are occupied by mLANA in each category.

