Figure.
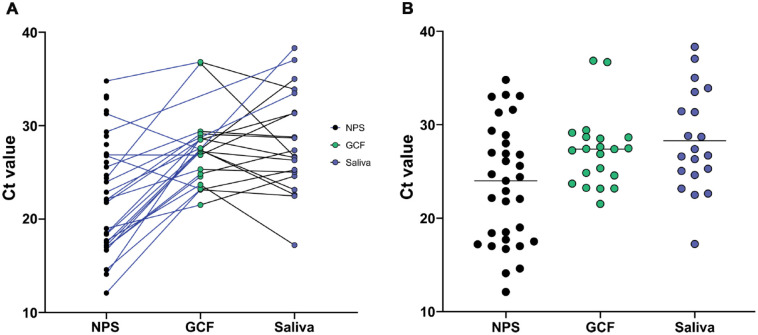
Comparison of Ct values between different clinical samples. (A) Patient matched samples, represented by the connecting lines. A blue line represents nasopharyngeal swab (NPS) pairing with gingival crevicular fluid (GCF) or saliva sample while a black line represents pairing between GCF and saliva. (B) All positive nasopharyngeal swabs (n = 33), GCF (n = 21), and saliva samples (n = 20) were compared. Mean Ct value is represented by a horizontal line in each group.

