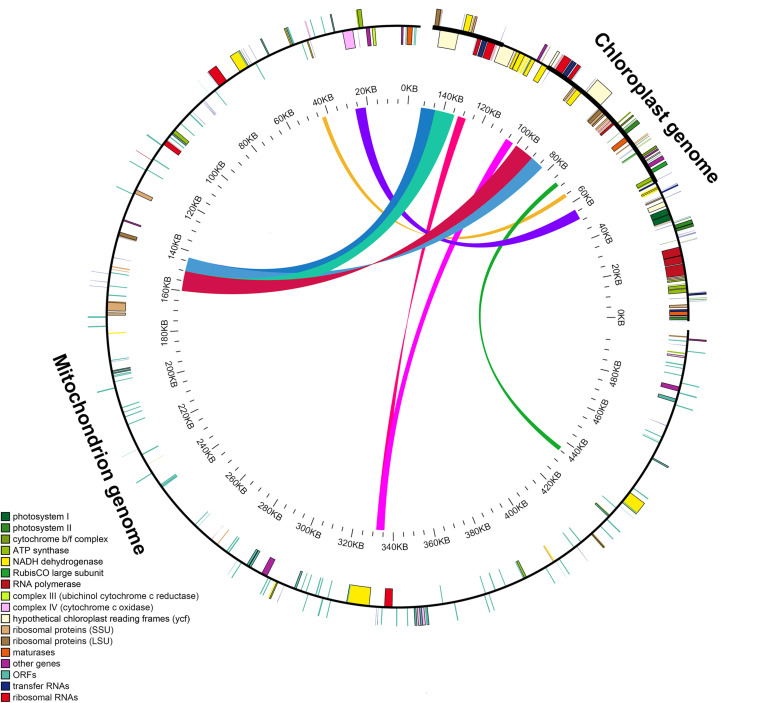
FIGURE 4.
Schematic for the chloroplast-to-mitochondrial gene transfer in Salvia species. A colored line within the circle represents the areas of the chloroplast genome that were transferred across the specified position in the mitochondrial genome. Genes shown inside and outside the circle have been transcribed in a clockwise and counterclockwise manner, respectively.

