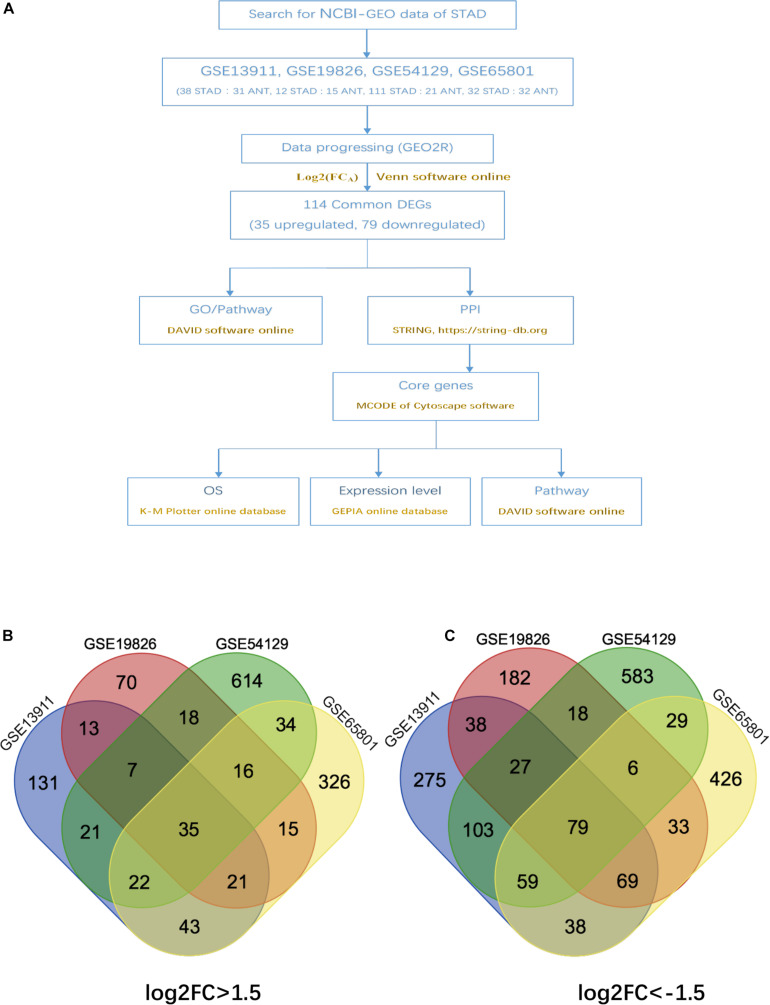
FIGURE 1.
Authentication of 114 common DEGs in the four datasets (GSE13911, GSE19826, GSE54129, and GSE65801) through venn diagrams software (available online at: http://bioinformatics.psb.ugent.be/webtools/venn/). Different color meant different datasets. (A) Overall diagram of the study. (B) 35 DEGs were up-regulated in the four datasets (log2FC > 1.5). (C) 79 DEGs were down-regulated in the four datasets (log2FC > –1.5).

