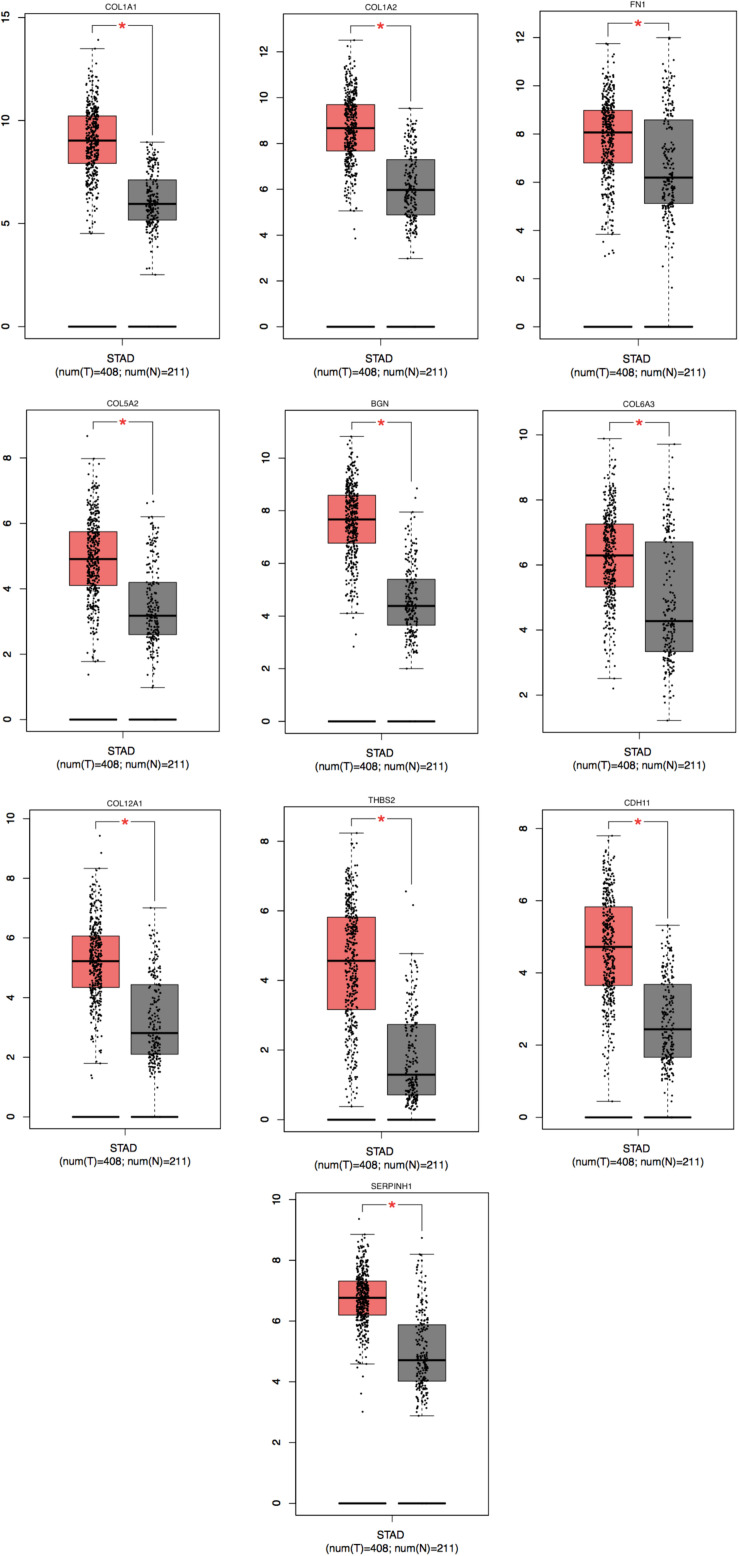
FIGURE 5.
Significantly expressed 10 genes in STAD cancer patients compared to healthy people. To future identify the genes’ expression level between STAD cancer and normal people, 10 genes which were related with poor prognosis were analyzed by GEPIA website. A total of 10 genes significant expression level in STAD specimen compared to normal specimen (*P < 0.05). Red color means tumor tissues and gray color means normal tissues.

