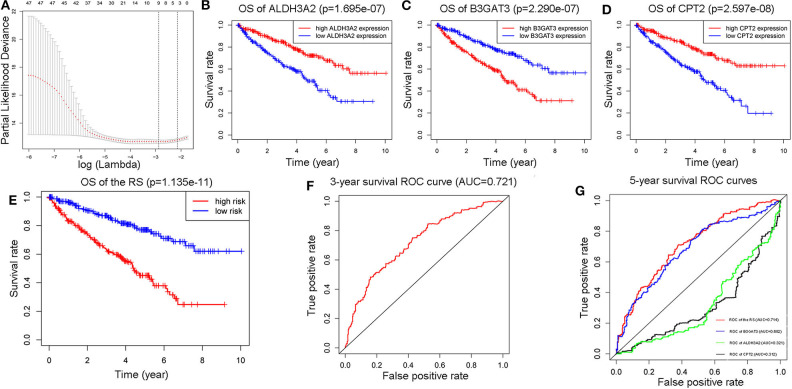
Figure 3.
Construction of a three-metabolic-genes RS model from 47 prognostic metabolic genes (A). Comparison of 5-year survival K-M plots of the three genes and the RS model they composed (B–E), a 3-year ROC curve of the RS model (F), and 5-year ROC curves of RS model along with those three genes (G).

