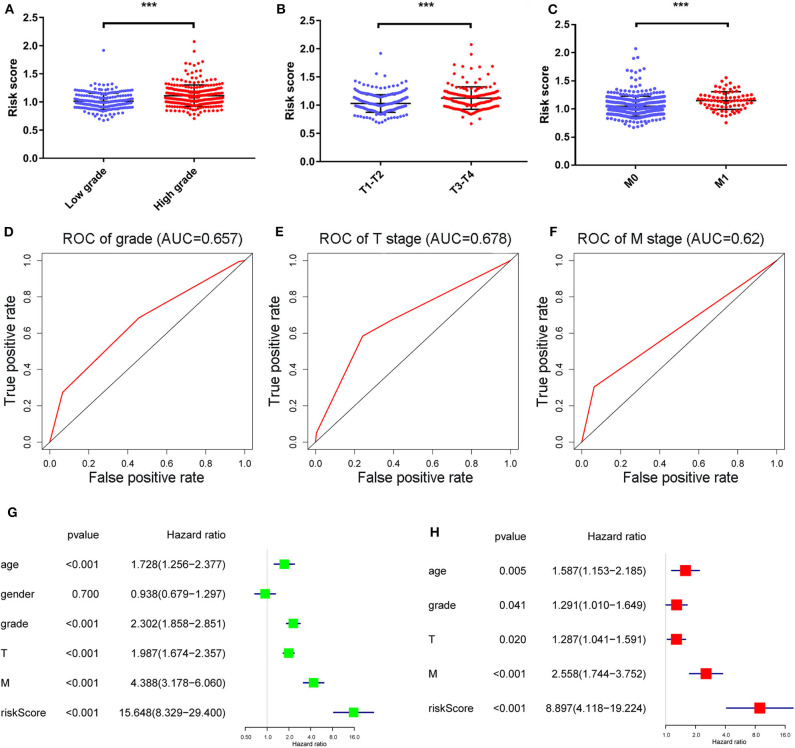
Figure 4.
The distribution of RS in ccRCC patients with high and low grades, T stage and M stage (A–C) and their correlated 5-year survival ROC curves (D–F). ***Means p < 0.01. Univariate and multivariate cox analyses of the RS model and other clinicopathological characteristics with overall survival (G,H).

