Fig. 1.
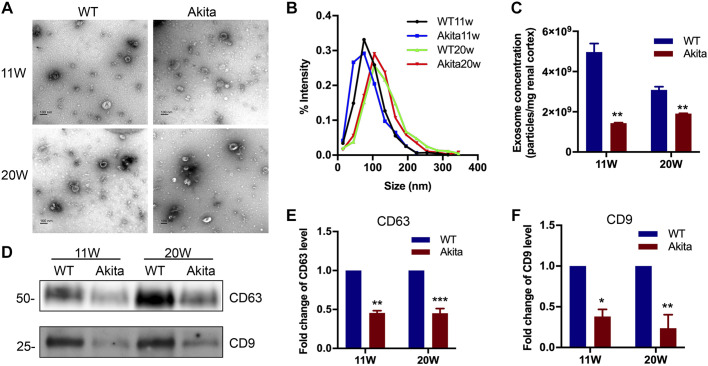
Characterization of exosomes derived from kidney cortex tissues of diabetic kidney disease (DKD) mice. Kidney cortical tissue of 11 wk (11W) or 20 wk (20W) Akita and wild-type (WT) mice were harvested and homogenized for exosome isolation and purification. The exosome pellets were collected for morphological and immunoblot analysis. A: representative morphological images of exosomes observed by transmission electron microscopy. Scale bars = 100 nm. B: size distribution of exosomes analyzed by nanoparticle tracking analysis. C: exosome quantification by nanoparticle tracking analysis after normalization with tissue weight. Values (in particle number/mg renal cortex tissue) are means ± SE of 4 animal groups (n = 4). **P < 0.01 vs. WT mice. D−F: induction of CD63 and CD9 expression in exosomes derived from 11W and 20W DKD mice. D: representative Western blot analysis demonstrating the decreased production of CD63 and CD9 expression in Akita mice. The loading volume of exosome protein lysis was normalized by tissue weight. E and F: semiquantitative analysis of the average optical density of CD63 (E) and CD9 (F). Values are presented as mean ± SD; n = 4. *P < 0.05, **P < 0.01, and *** P < 0.001 vs. the WT group.

