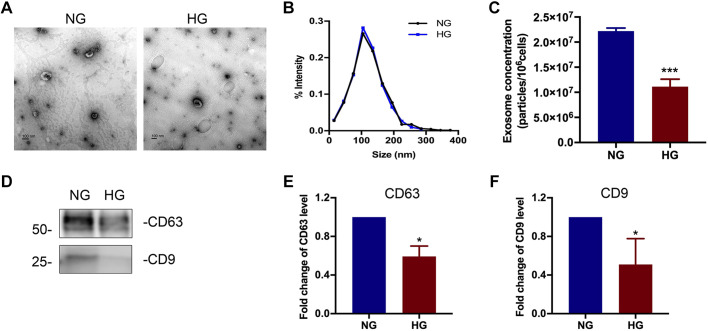
Fig. 3.
Characterization of exosomes derived from high glucose (HG)-treated renal tubular cells. A: representative images of exosomes observed by transmission electron microscopy. Scale bars = 100 nm. B: size distribution of exosomes analyzed by nanoparticle tracking analysis. C: exosome quantification by nanoparticle tracking analysis after normalization with cell numbers. n = 5. ***P < 0.001 vs. the normal glucose (NG)-treated group. D−F: comparison of CD63 and CD9 expression in exosomes derived from tubular cells in NG- or HG-treated groups. D: representative Western blot analysis demonstrating the decreased production of CD63 and CD9 expression in the HG-treated group. The loading volume of exosome protein lysis was normalized by cell numbers. E and F: semiquantitative analysis of the average optical density of CD63 (E) and CD9 (F). Values are presented as means ± SD; n = 5. *P < 0.05 vs. the NG-treated group.

