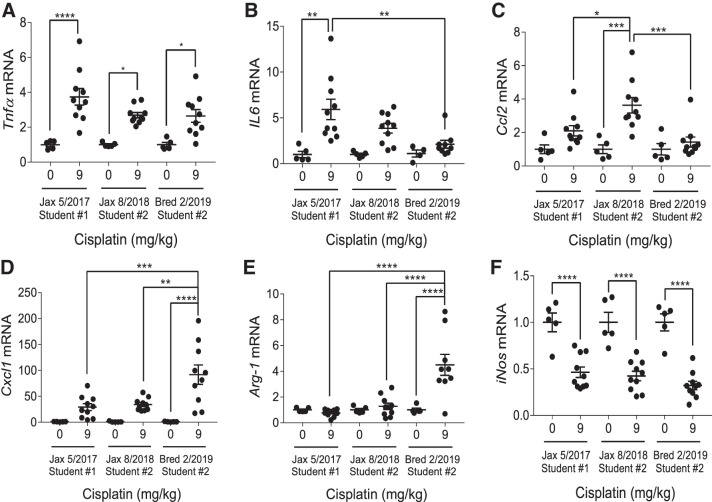
Fig. 6.
Inflammatory cytokine production in C57BL/6 mice treated with repeated administration of 9 mg/kg cisplatin. mRNA from the renal cortex was analyzed with quantitative RT-PCR to determine levels of tumor necrosis factor-α (Tnfα) (A), interleukin 6 (IL6) (B), C-C motif chemokine ligand 2 (Ccl2) (C), C-X-C motif chemokine ligand 1 (Cxcl1) (D), arginase 1 (Arg-1) (E), and inducible nitric oxide synthase (iNos) (F). Expression levels were normalized to β2-microglobulin. Statistical analysis was determined by two-way ANOVA followed by a Tukey’s post-hoc test. *P < 0.05, **P < 0.01, ***P < 0.001, and ****P < 0.0001.

