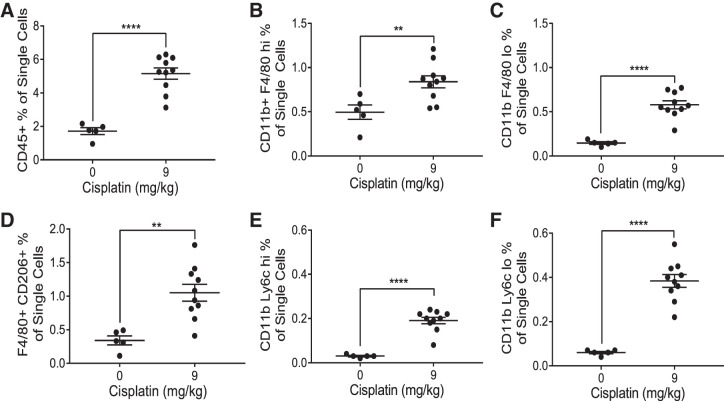
Fig. 9.
Flow cytometric analysis of renal macrophages and monocytes. Whole kidneys were homogenized and ~1 million cells were stained. One million events were collected from each sample. Analysis identified CD45+ immune cells (A), CD11b+ F4/80 hi resident macrophages (B), CD11b+ F4/80 lo infiltrating macrophages (C), F4/80+ CD206+ M2 macrophages (D), CD11b+ Ly6c hi inflammatory monocytes (E), and CD11b+ Ly6c lo resident monocytes (F). Populations are expressed as a percentage of the number of single cells counted. Statistical analysis was determined by one-way ANOVA. **P < 0.01 and ****P < 0.0001.

