Fig. 3.
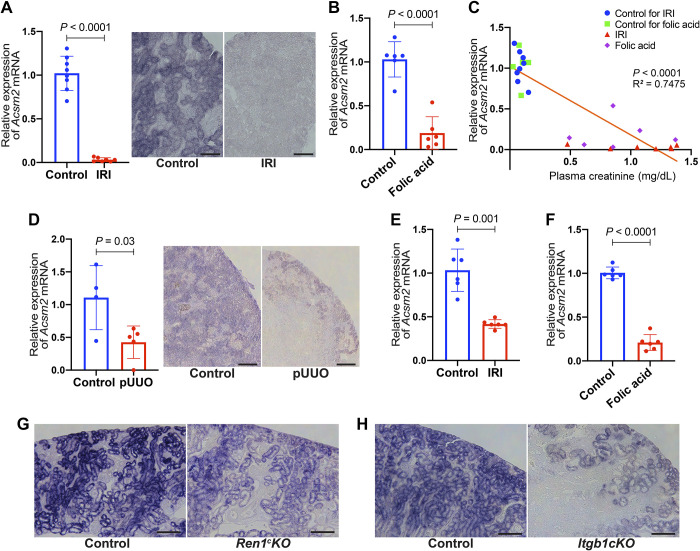
Acyl-CoA synthetase medium-chain family member 2 (Acsm2) expression decreases in multiple types of mouse kidney disease models. A: Acsm2 gene expression was decreased in the kidneys with acute kidney injury (AKI) by bilateral kidney ischemia-reperfusion injury (IRI). Quantitative RT-PCR was performed (n = 8 control; n = 7 IRI). In situ hybridization showed lower expression of Acsm2 in proximal tubular cells of kidneys subjected to bilateral IRI compared with control. Bars = 100 µm. B: quantitative RT-PCR showed a decrease in Acsm2 mRNA expression in kidneys with AKI 24 h after injection of folic acid (n = 6 each). C: there was a negative correlation between Acsm2 expression in the kidney and plasma creatinine. The x-axis shows plasma creatinine levels (in mg/dL), whereas the y-axis shows relative expression of Acsm2 mRNA. Each dot represents the values (creatinine, mRNA) obtained from each individual animal belonging to the AKI models and their controls. The line is the fitted correlation value. D: Acsm2 mRNA expression by quantitative RT-PCR in kidneys was decreased following partial unilateral ureteral obstruction (pUUO; n = 4 control, n = 5 pUUO). In situ hybridization showed lower expression of Acsm2 in tubular cells from kidneys subjected to pUUO. Bars = 200 µm. E: quantitative RT-PCR showed a decrease in Acsm2 mRNA expression in the kidneys with chronic kidney disease, 14 days after unilateral IRI (n = 6 each). F: quantitative RT-PCR showed a decrease in Acsm2 mRNA expression in another chronic kidney disease model at 14 days after injection of folic acid (n = 6 each). G: expression of Acsm2 mRNA in proximal tubular cells of kidneys of Ren1c gene knockout (Ren1cKO) mice was lower than that of control. Bars = 200 µm. H: conditional knockout of the β1-integrin (Itgb1) gene in cells of kidneys from the renin progeny (Itgb1cKO) showed lower expression of Acsm2 in proximal tubular cells compared with control. Bars = 200 µm. All data are reported as means ± SD. Statistical comparison was by Student’s t test.

