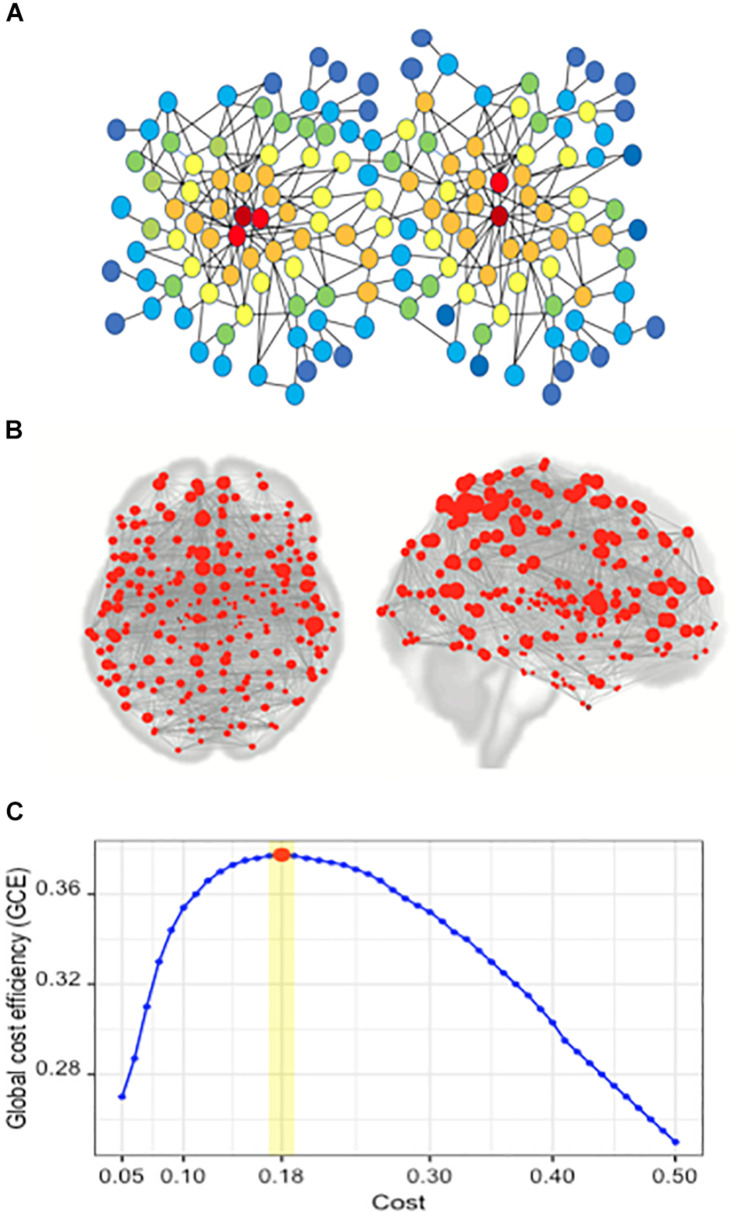
FIGURE 1.
Network and the concept of degree centrality; the brain network of the Brainnetome atlas’ ROIs; finding the optimal cost. (A) In the illustrated network, the red nodes have the highest degree centrality, and the color spectrum from red to blue represents the gradual reduction of degree centrality. (B) Red circles represent the nodes in a brain network, composed of 246 nodes. In this network, each node is one of the 246 ROIs of the Brainnetome Atlas. (C) Plot of global cost efficiency vs. Cost averaged across all subjects in young HC, senior and MCI groups.

