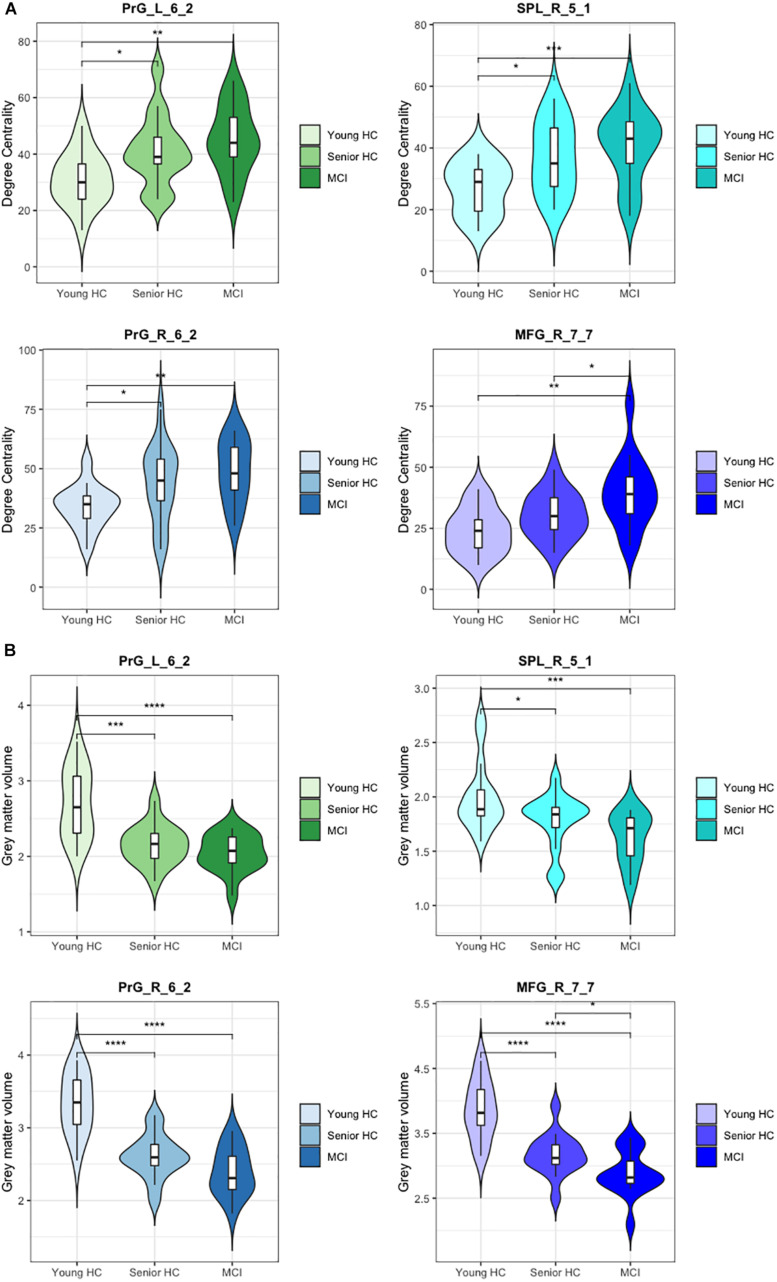
FIGURE 3.
Degree centrality and gray matter volume of compensatory ROIs. Illustration of (A) the degree centrality and (B) the gray matter volume of the right and the left precentral gyri caudal dorsolateral area 6 (Brainnetome label: PrG_R_6_2 and PrG_L_6_2), the superior parietal lobe, rostral area 7 (Brainnetome label: SPL_R_5_1), and the right middle frontal gyrus, lateral area 10 (Brainnetome label: MFG_R_7_7). (*) indicates statistical significance (p < 0.05, FDR-Corrected), (**) indicates statistical significance (p < 0.01, FDR-Corrected), (***) indicates statistical significance (p < 0.005, FDR-Corrected), (****) indicates statistical significance (p < 0.001, FDR-Corrected).

