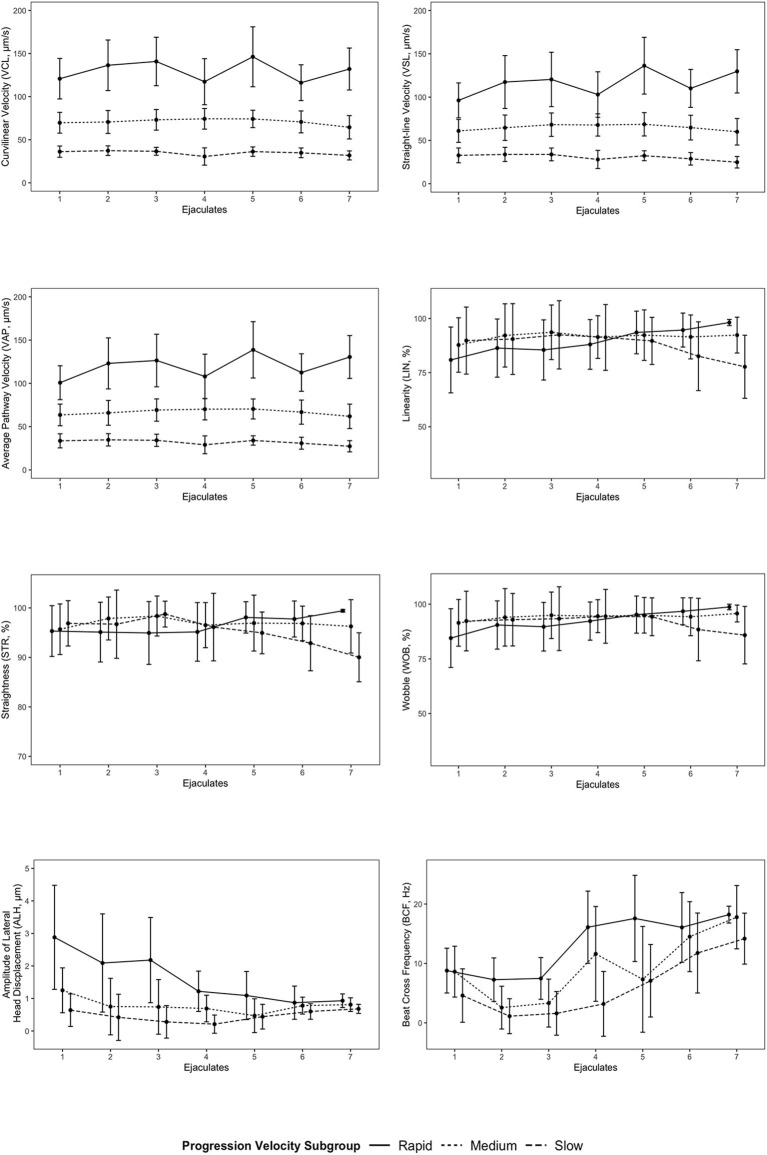
Figure 4.
Mean values of progression velocity subgroups for each kinematic parameter for each individual ejaculate sample. Error bars represent standard deviation. Points for progression velocity subgroups for each ejaculate sample are offset for linearity (LIN), straightness (STR), wobble (WOB), amplitude of lateral head displacement (ALH), and beat cross frequency (BCF) to provide visual clarity between each subgroup.

