Figure 3.
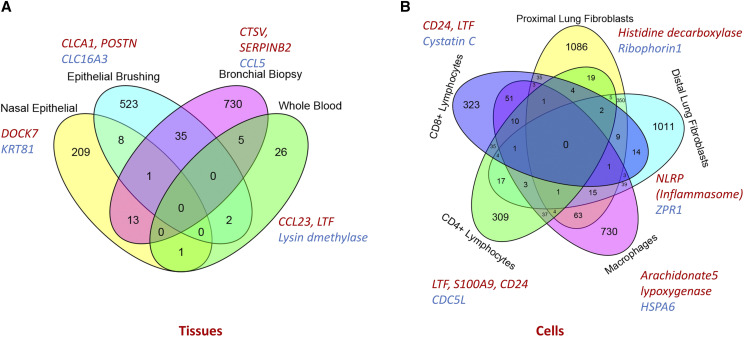
Gene-level overlap: Venn diagram showing overlap of differentially regulated genes identified from tissue samples (A; airway epithelial, bronchial, nasal and whole blood samples) and isolated cellular samples (B; lymphocytes, fibroblasts and macrophages). There is considerable overlap at the gene-level between airway epithelial and bronchial biopsy samples. However, each sample type shows a unique asthma-relevant gene expression pattern; DEG sharing is not observed between all samples. Top significant tissue/ cell-specific DEGs (red up-regulated, blue down-regulated) have been shown for each sample type.

