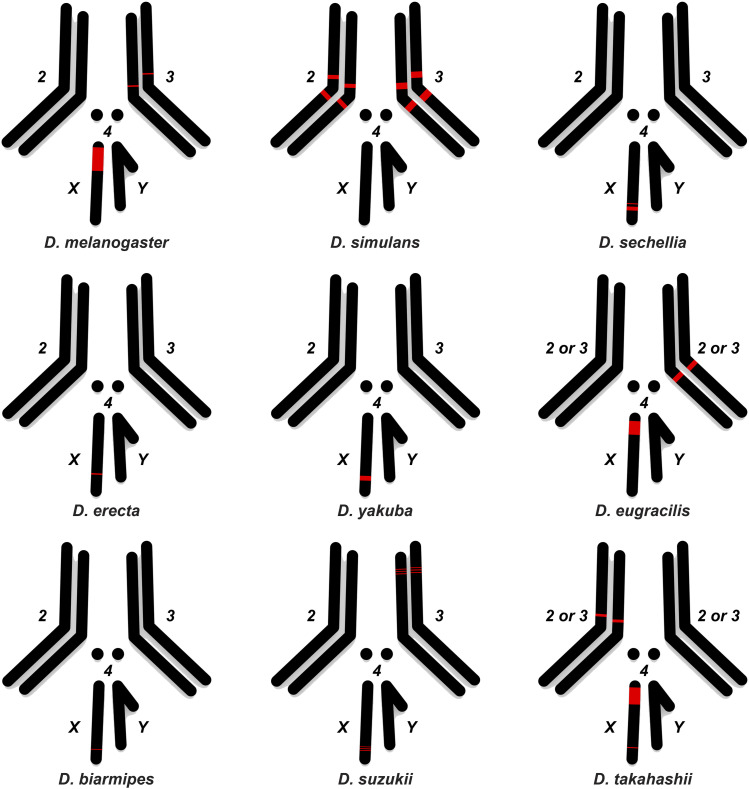
Figure 5.
Ideogram showing chromosomal location of 1.688 heterochromatic arrays mapped by FISH in nine Drosophila species from the melanogaster group. Simplified karyotypes (black) from D. melanogaster, D. simulans, D. sechellia, D. erecta, D. yakuba, D. eugracilis. D. biarmipes, D suzukii and D. takahashii are shown along with the approximate location and relative abundance of 1.688 satDNA (red) for each species. Note that although chromosomes may have different sizes in each species, the ideograms are similarly sized for the sake of simplicity. The 1.688 satDNA arrays on chromosome 2L in D. melanogaster described by Abad et al. (2000) were not detected with the probes in this study (see Table 1).

