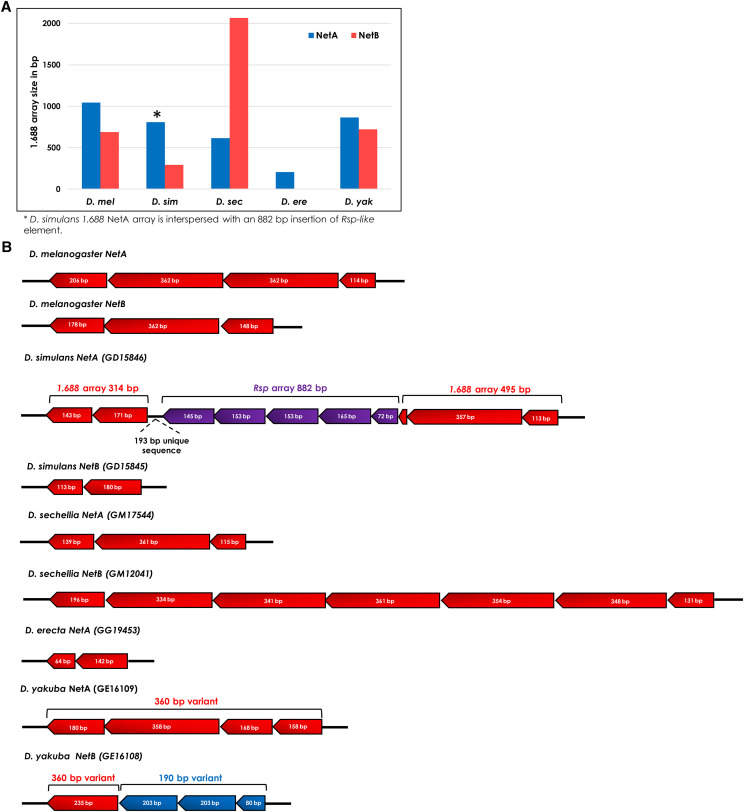
Figure 9.
Differential pattern of 1.688satDNA insertions in the intronic regions of duplicated genes NetA and NetB in five species of the melanogaster subgroup. A. Histogram representation of 1.688 array size insertion in the intronic regions of NetA and NetB genes, respectively, for five species of melanogaster subgroup. B. Schematic representation of 1.688 insertion in the intronic regions of NetA and NetB genes in five species of melanogaster subgroup evidencing a species-specific pattern of 1.688 array size and organization. The 360 bp subfamily is represented in red, whereas the 190 bp subfamily is in blue. Responder-like arrays are represented in purple. Note that repeat units sizes identified here are based on the monomeric sequence designed for each species.

