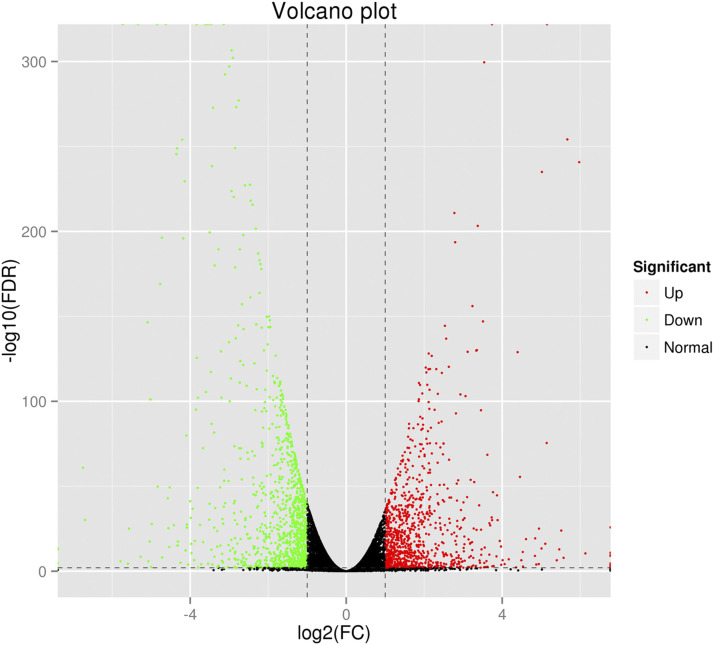
Figure 3.
Volcano plot of differentially expressed genes in cells with normal and inhibited expression of gga-miR-135a-5p. The X-axis represents log2 (FC) and Y -axis represents –log10 (FDR). The green dots indicate the down-regulated genes, the black dots indicate the genes with no significant differences, and the red dots indicate up-regulated genes.

