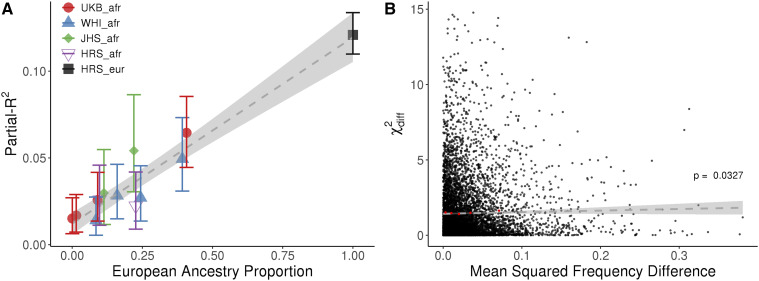
Figure 5.
Unweighted PRS and the effect of local allele frequency differences on effect size differences. A: Partial-R2 for an unweighted PRS that uses the sign but not the magnitude of each SNP effect (Methods). Each admixed population is split up into quantiles of European ancestry proportion. Vertical bars represent 95% confidence intervals estimated from a case resampling bootstrap (1,000 replicates). The dashed line shows the regression with standard errors shaded in light gray. B: X-axis, mean squared frequency difference for PRS SNPs for European and African ancestries in a 6 Kb window around each PRS SNP (Methods). Frequencies were calculated per dataset (HRS_eur, HRS_afr) for the causal allele. Y-axis, statistic for the difference in betas between European and Admixed African ancestries (Equation 1) in WHI_afr. Cut-off at 15 for display purposes excludes 15 data points. Dashed line shows the regression with standard errors shaded in light gray. Red points represent the median recombination rate for each of 5 quantiles of mean squared difference.

