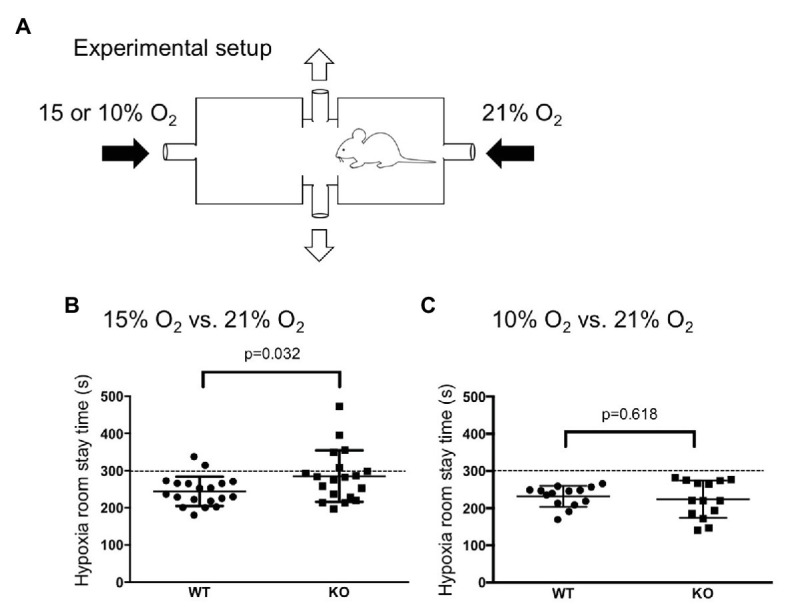
Figure 2.

Hypoxia avoidance test. (A) Illustration of an apparatus to create an oxygen concentration gradient in which a mouse can move back and forth (see method section for detail). (B,C) WT mice (n = 19) avoided both mild (15% O2, B) and severe (10% O2, C) hypoxia whereas knockout (KO) mice (n = 19) avoided only severe hypoxia. The dotted lines at 300 s indicates chance level during the observation period of 10 min. Horizontal lines indicate mean and SEM. The difference between the two genotypes was assessed using the Student’s t-test, and value of p is shown.
