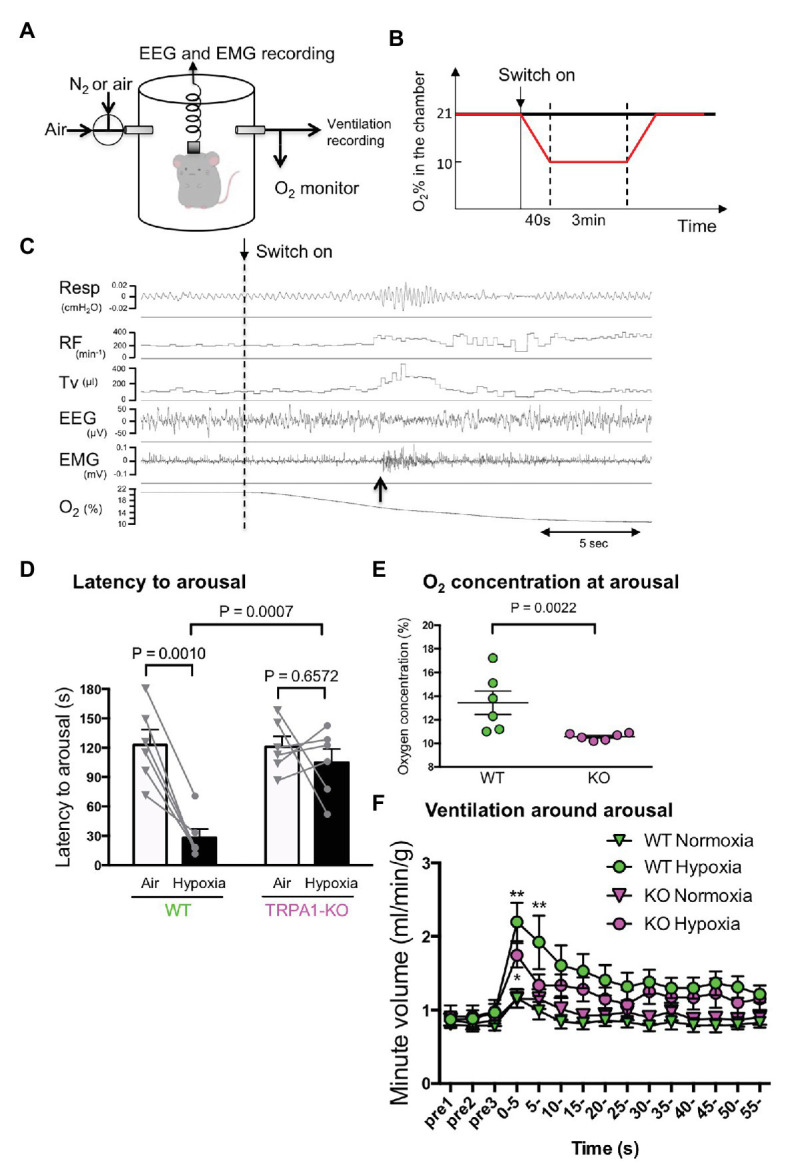
Figure 3.

Hypoxia-induced wakeup test. (A) Simultaneous measurement of EEG, EMG, and ventilation by whole body plethysmography. Continuous measurement was obtained using flow-through type body plethysmography. (B) Experimental schedule used to apply hypoxia to mice. (C) Typical recording from a WT mouse showing ventilatory parameters (RF, respiratory frequency; TV, tidal volume), electrophysiological measures, and O2 concentration in the chamber. The dashed vertical line shows the timing when the inflow was changed from room air to hypoxic (10% O2) gas. The upward arrow shows the timing when the mouse woke up as judged by EEG and EMG. Note that the increase in ventilation was not associated with the start of hypoxia but with the timing of arousal. (D) Latency to arousal from the time of inflow change. The bar indicates mean and SEM, n = 6 for both WT and KO mice. Two-way ANOVA revealed a significant difference between genotypes (F1,10 = 9.851, p = 0.0105) and between gas conditions (F1, 10 = 17.24, p = 0.0020). Values of p from Sidak’s multiple comparison test are shown. (E) O2 concentration in the chamber at arousal. A nonparametric Mann-Whitney U-test was used to compare WT and KO mice because data in KO mice were not normally distributed. (F) Minute ventilation was calculated by RF × TV, normalized with body weight and averaged every 5 s with arousal timing set to be time zero. Two-way ANOVA revealed there was a significant difference among times (F14, 280 = 16.20, p < 0.0001) but not among genotypes × gas conditions (F3, 20 = 2.786, p = 0.0673).
