Figure 5.

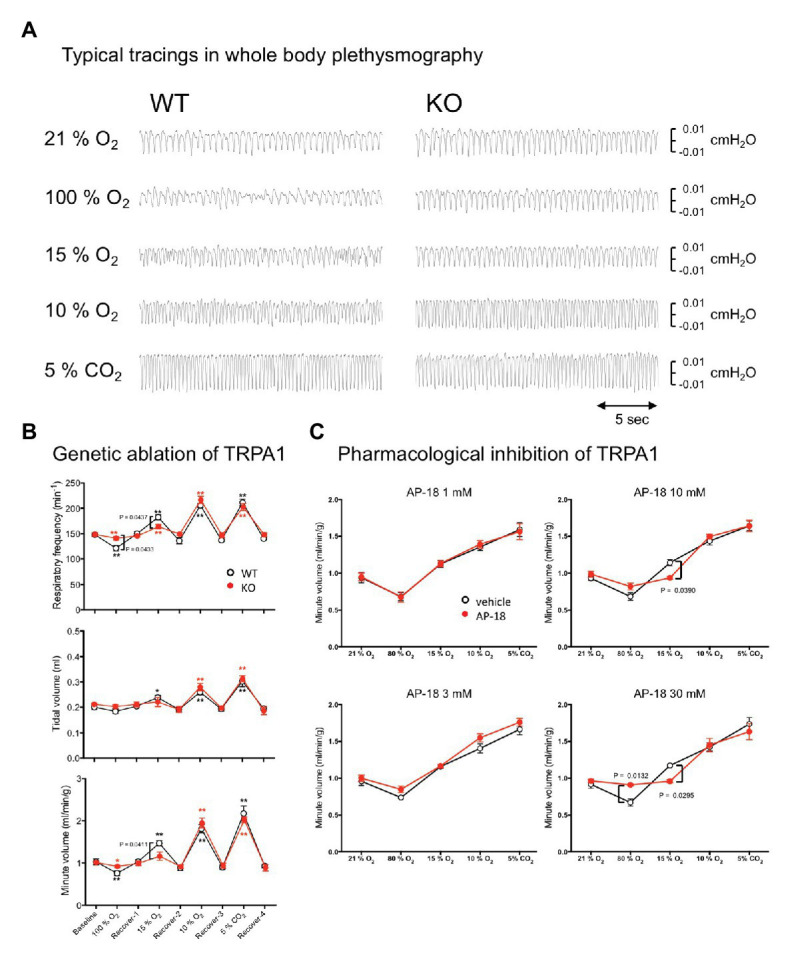
Effect of genetic and pharmacological inhibition of TRPA1 on respiratory chemoreflex. (A) Representative tracing of pressure signals in whole body plethysmography. Respiration of WT and KO mice was measured using flow-through type whole body plethysmography. Every gas condition was maintained for 3 min, and the data were collected during the last 20-s period. Each stimulus was separated by intervals of 20 min or more of normal room air. Plethysmographic signal that is a pressure difference between the measuring chamber and the reference chamber, and O2 concentration in the measuring chamber were continuously monitored. Data for baseline and recovery periods were obtained during the last 3 min before the next stimulation. (B) Group data obtained in whole body plethysmography. Data are shown as mean ± SEM. n = 8 for WT and n = 8 for KO mice. Two-way ANOVA revealed that there was a significant difference among gas conditions (F8, 112 = 101.7, p < 0.0001) and interaction between gas condition and genotype (F8, 112 = 2.415, p = 0.0191). *p < 0.05, **p < 0.01 as compared to preceding control values (one-way ANOVA followed by Sidak’s multiple comparisons test). Values of p in the figure were calculated by Sidak’s multiple comparison test to compare between WT and KO mice. (C) Using four sets of WT animals (n = 5/group), the possible effect of the TRPA1-blocker, AP-18, on respiratory chemoreflex was examined. Every animal was exposed to an aerosol made from vehicle (20% ethanol in saline) and an assigned concentration of AP-18 solution. Data are shown as mean ± SEM. Two-way ANOVA revealed that there was a significant interaction among drugs × gas conditions for 10 mM (F4, 16 = 3.668, p = 0.0265) and 30 mM (F4, 16 = 6.386, p = 0.0029) but not for 1 mM (F4, 16 = 0.1507, p = 0.9600) and 3 mM (F4, 16 = 0.7821, p = 0.5532). Values of p in the figure were calculated by Sidak’s multiple comparison test.
