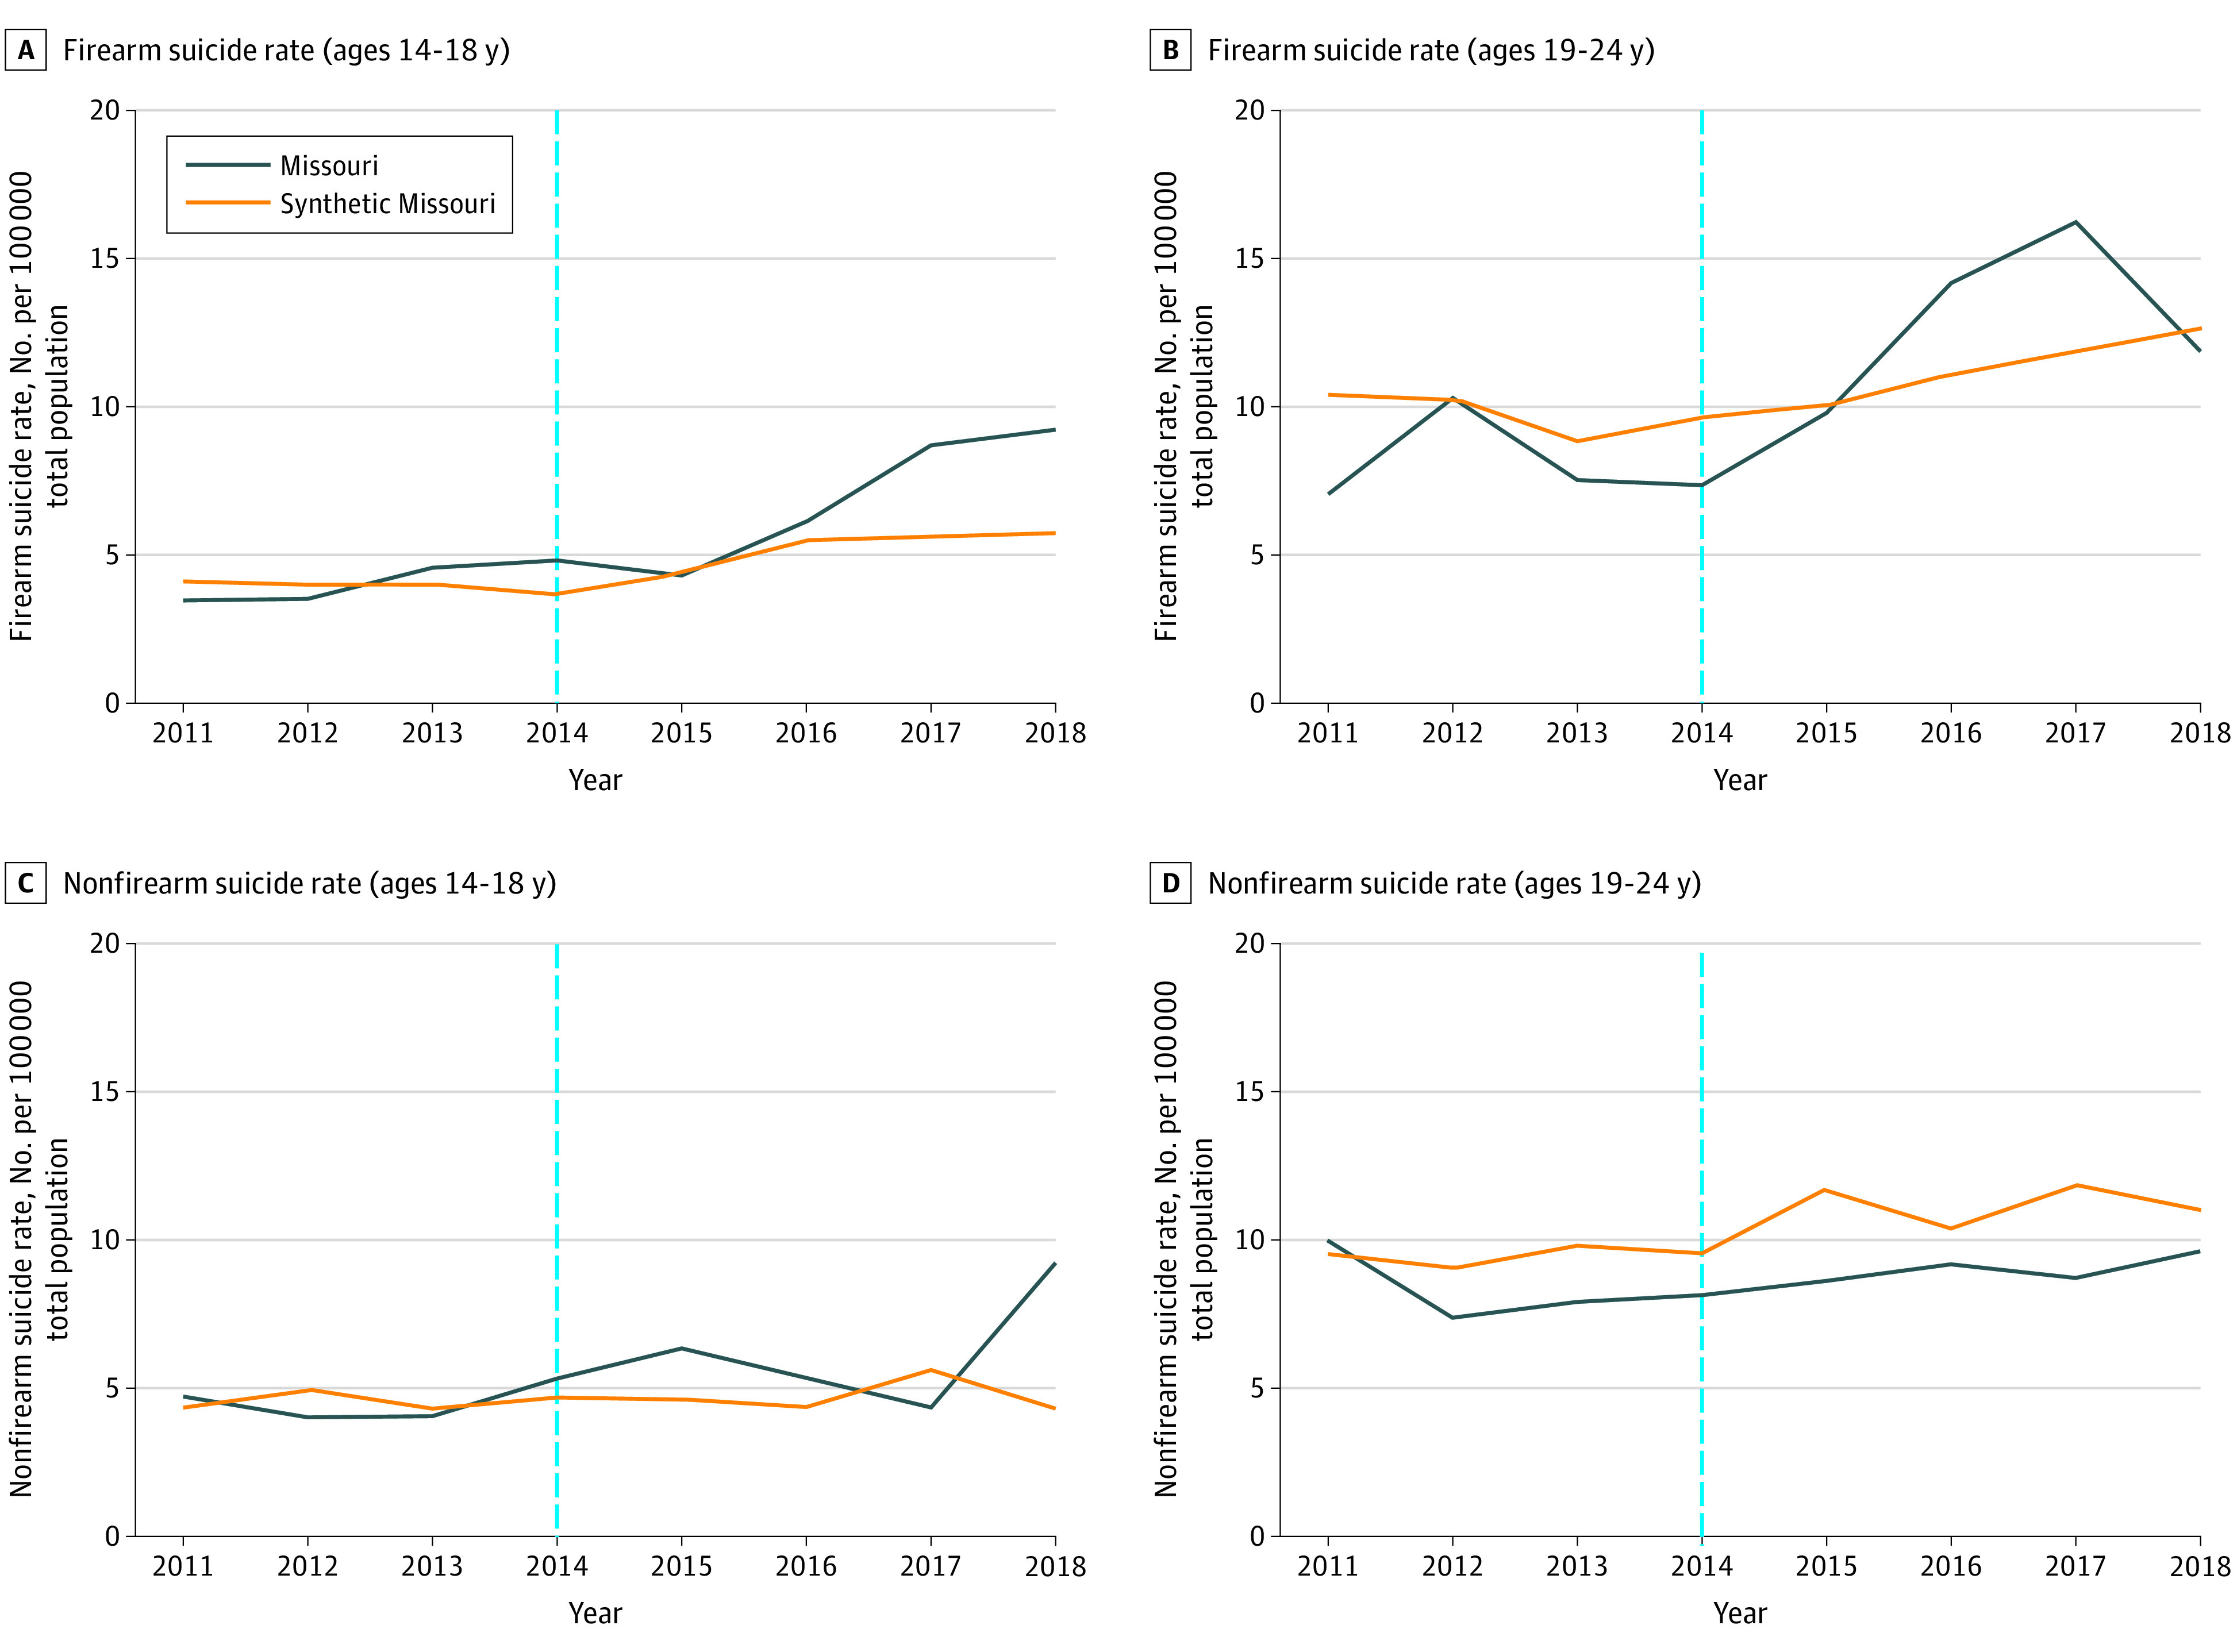
Figure 3. Trend in Annual Rate of Firearm and Nonfirearm Suicides per 100 000 People in Missouri and Synthetic Missouri Over the 2014 Concealed Carry Study Period.

The blue dotted line indicates the year the concealed carry law was passed in the Missouri state legislature. Synthetic Missouri is a weighted combination of control states that best approximated relevant characteristics of Missouri prior to the law changes examined by the study.
