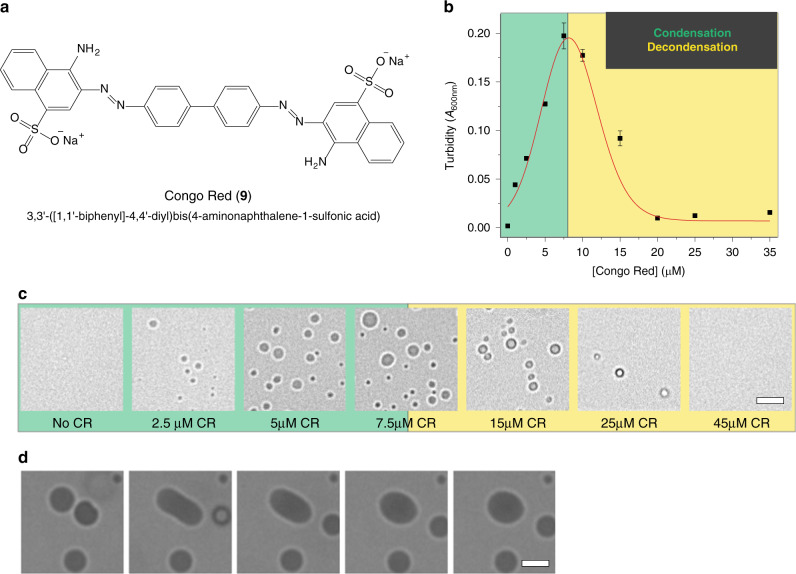
Fig. 5. Congo red modulates the phase behavior of the TDP-43 LCD.
a Chemical structure of Congo red (CR, 9). b Turbidity of TDP-43 LCD (untagged; 5 μM) as a function of Congo red concentration. c Representative bright field microscopy images of CR/TDP-43 LCD system. d Representative images of CR/TDP-43 LCD droplet fusion event (molar ratio of CR to TDP-43 of 1.3:1). Scale bars: 5 μm. Experiments were performed in a 20 mM potassium phosphate buffer, pH 6.0. All data are presented as mean values ± standard deviation (n = 3 technical replicates).

