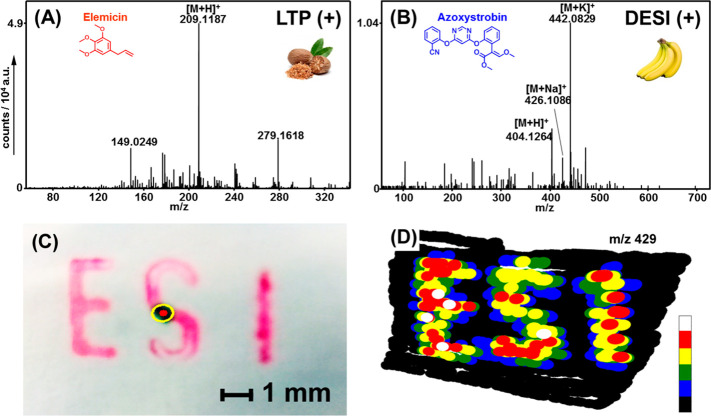
Figure 4.
(A, B) Detection of chemicals in complex matrixes. (A) A Nutmeg was analyzed with the LTP ion source and (B) a banana skin was analyzed using the DESI ion source. (C, D) EASI-IMSI experiment in positive ion-mode. (C) Letters were imprinted on white paper using a red ink. (D) False color ion image representing the relative signal intensities found at m/z = 429 (from black = 0% to white = 100%).

