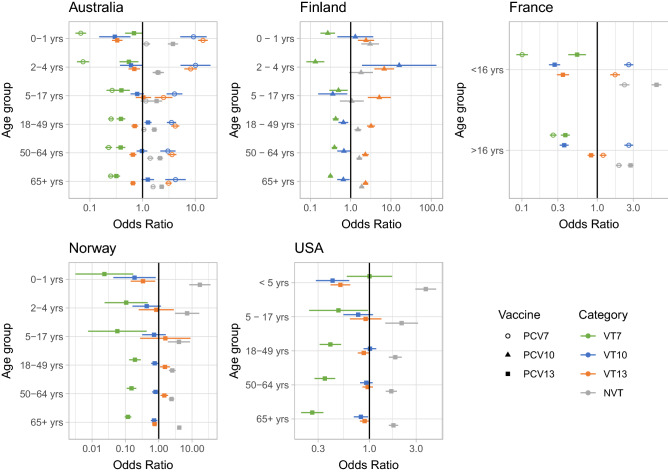
Figure 1.
Point estimates and 95% confidence intervals (CI) of age-stratified odds ratios (OR) relating IPD caused by serotype category after vaccine implementation. Estimated as the product of the IPD cases by a serotype category post-vaccination and the IPD cases by all other serotype categories pre-vaccination divided by the product of IPD cases by the serotype category pre-vaccination and the IPD cases by all other serotype categories post-vaccination. VT7: PCV7 serotypes; VT10: 1, 5, 7F; VT13: 3, 6A, 19A; NVT: non-vaccine types.

