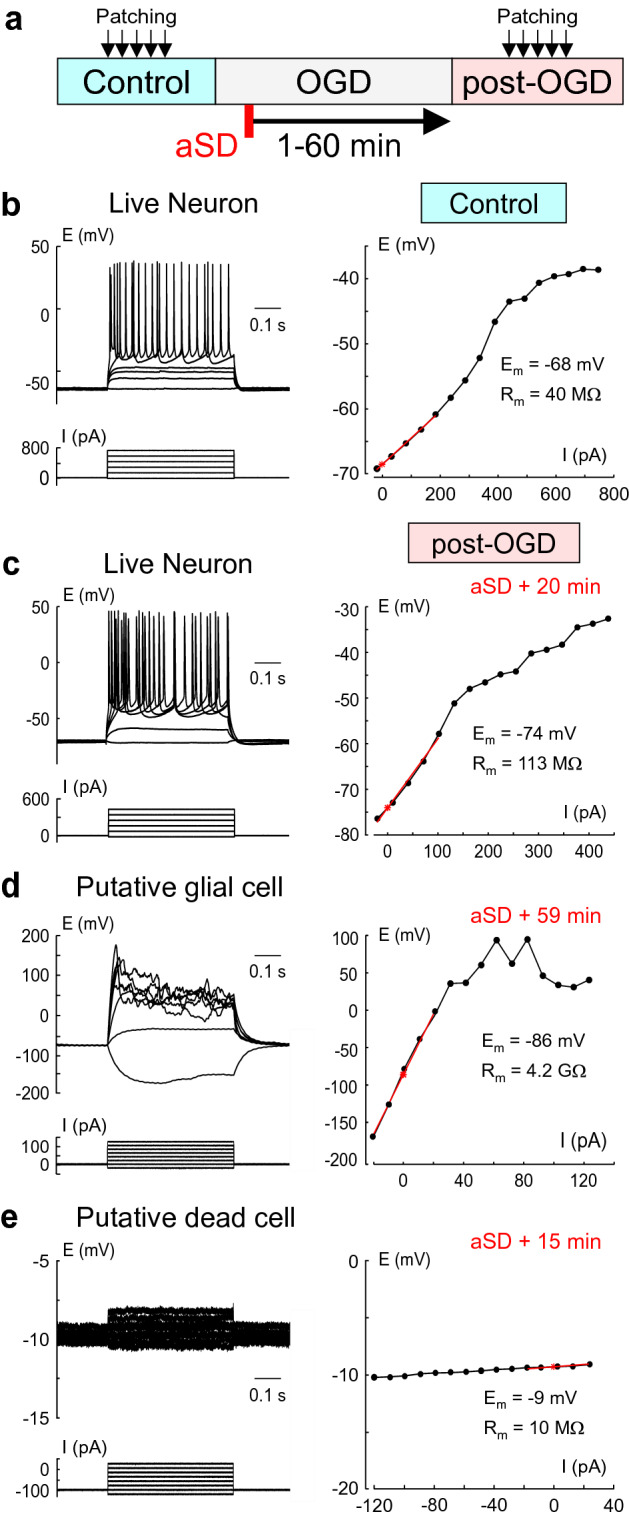
Figure 2.

Variety of electrophysiological outcomes from OGD using short-term whole-cell recordings. (a) Scheme of the experiment. Cells were sampled using short-term (~ 1 min long) patch-clamp recordings in control conditions and during reperfusion following OGD of various durations (from 1 to 60 min after aSD). (b) Voltage responses (top traces) generated by current injections (bottom traces) recorded from a L4 neuron prior to OGD. The corresponding I-V plot is shown on the right, where the red line shows the range in which Rm was measured, and Em and Rm are indicated on the right of the I-V curve. (c) Example traces obtained from a L4 neuron which survived OGD with reperfusion started 20 min after aSD. (d) L4 cell which survived OGD with reperfusion started 59 min after aSD, and which has been classified as a putative glial cell due to very negative Em, high Rm and inability for spike firing. (e) Putative dead cell with low Rm and strongly depolarized Em.
