Figure 11.
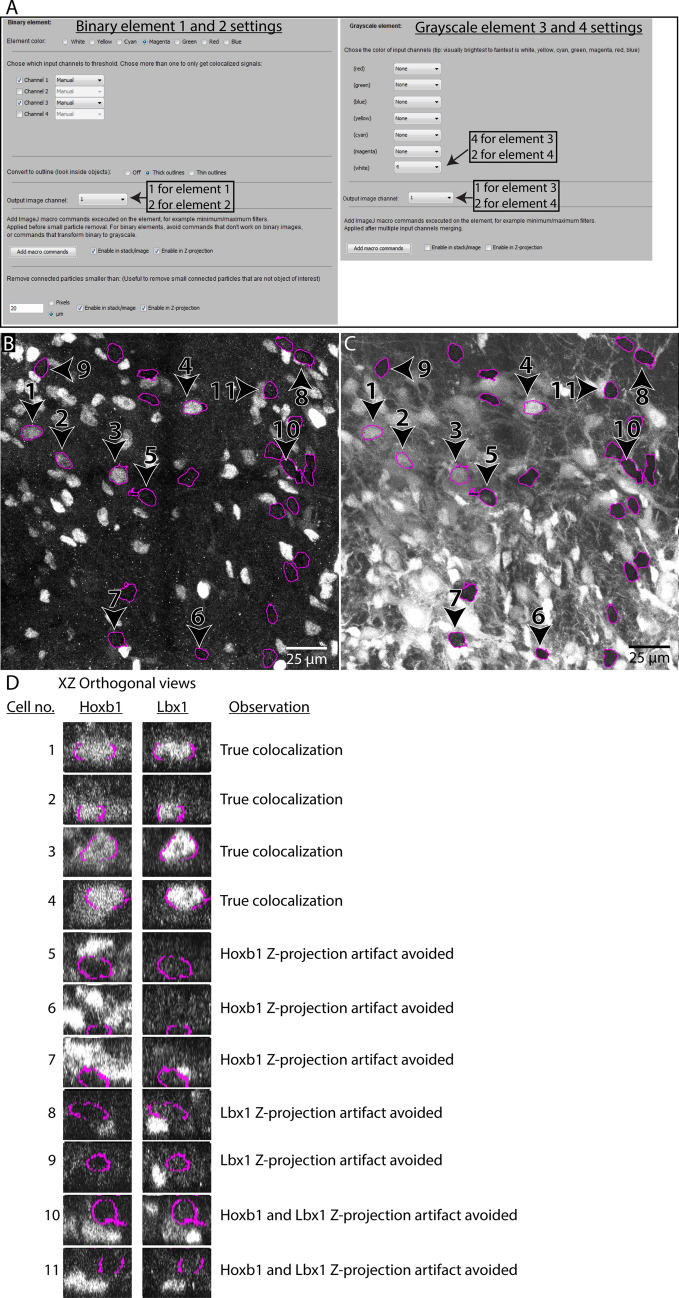
Example of usage 2. Visualizing colocalization between immunostaining, retrogradely labeled neurons, and reporter protein expression using the Colocalization Image Creator (A) Overview of the element settings used with the Colocalization Image Creator plugin to create the output shown in (B,C). Four channels of the input image (see Fig. 9) are used: channel 1 showing nuclear staining (Hoechst 33258), channel 2 showing neurons expressing the tdTomato reporter protein, channel 3 showing retrogradely labeled neurons, and channel 4 showing immunostaining for the transcription factor Lbx1. (B) The Z-projection output of channel 1 of the output image, comprising elements 1 and 3, visualizing respectively outlines of the nuclei of retrogradely labeled neurons (magenta) and Lbx1 immunostaining (white). (C) The Z-projection output of channel 2 of the output image, comprising elements 2 and 4, visualizing respectively outlines of the nuclei of retrogradely labeled neurons (magenta) and tdTomato reporter expression (white). (D) XZ orthogonal views of neurons from the output image stacks in output channel 1 (left column) and output channel 2 (right column). These images are not part of the plugin output, but are shown to aid in evaluating the efficiency of Z-projection artifact removal. Neurons are numbered as indicated in (B,C). Different rows show examples of true colocalization and examples of Z-projection artifacts in each output channel.

