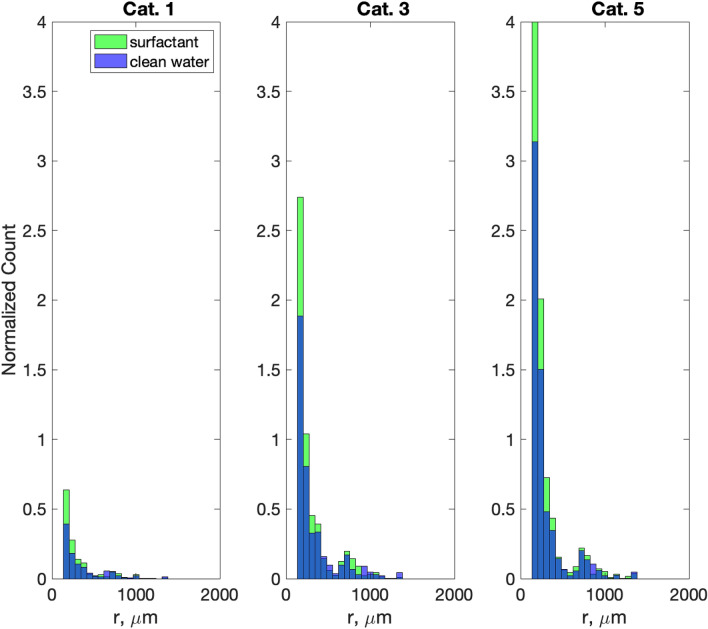
Figure 4.
Spray radius distributions for Category 1 (4 Nm−2), 3 (10 Nm−2), and 5 (20 Nm−2) tropical cyclone conditions in the VOF-to-DPM. Scales below 100 μm are not completely resolved (see Fig. 2) and have been removed from graphs. To demonstrate the increase of spray generation with wind due to the presence of surfactants for all tropical cyclone categories, the vertical axis has been normalized by the total number of samples for the Category 1 clean water case. The total number of spray particles before normalization in bins 3–21 for each panel are as follows: Cat. 1 clean water 8701, surfactant 12,073; Cat. 2 clean water 36,942, surfactant 48,074; Cat. 5 clean water 55,193, surfactant 74,104.

