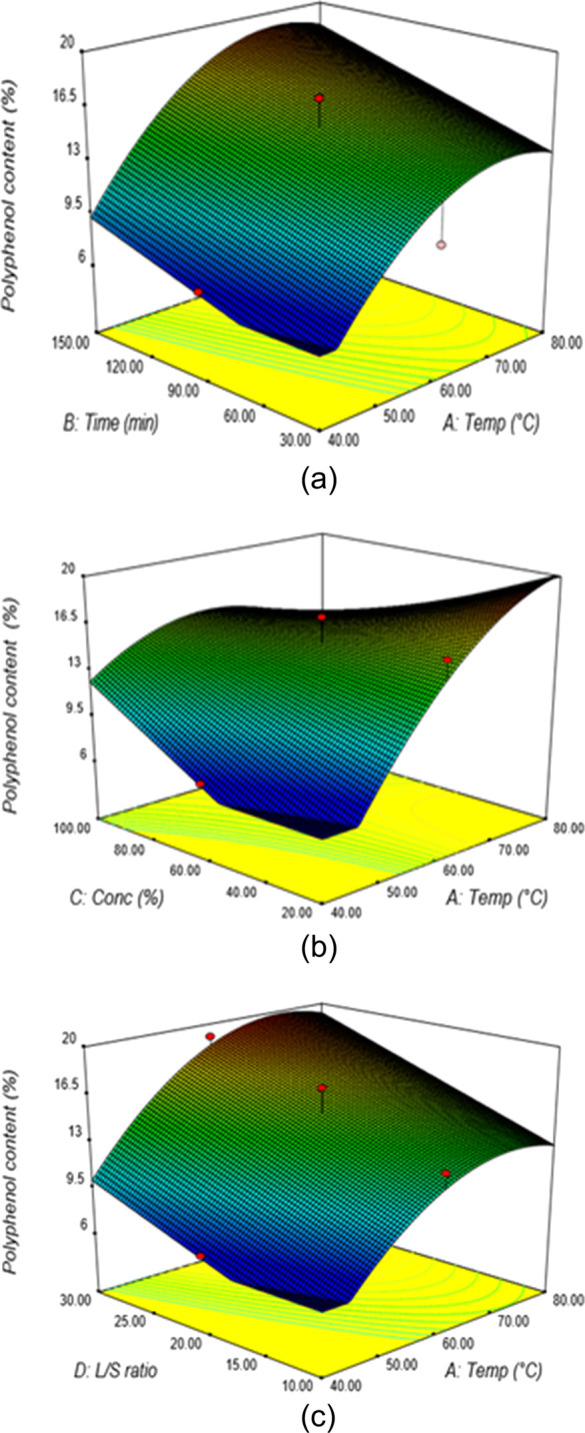
Figure 7.

(a) Response surface plots showing the percentage of polyphenol content from aqueous ethanol extraction at varying extraction temperatures and times (C = 60%, V = 20). (b) Response surface plots showing the percentage of polyphenol content from aqueous ethanol extraction at varying solvent concentrations and extraction temperatures (t = 90 min, V = 20). (c) Response surface plots showing the percentage of polyphenol content from aqueous ethanol extraction at varying liquid–solid ratios and extraction temperatures (t = 90, C = 60%).
