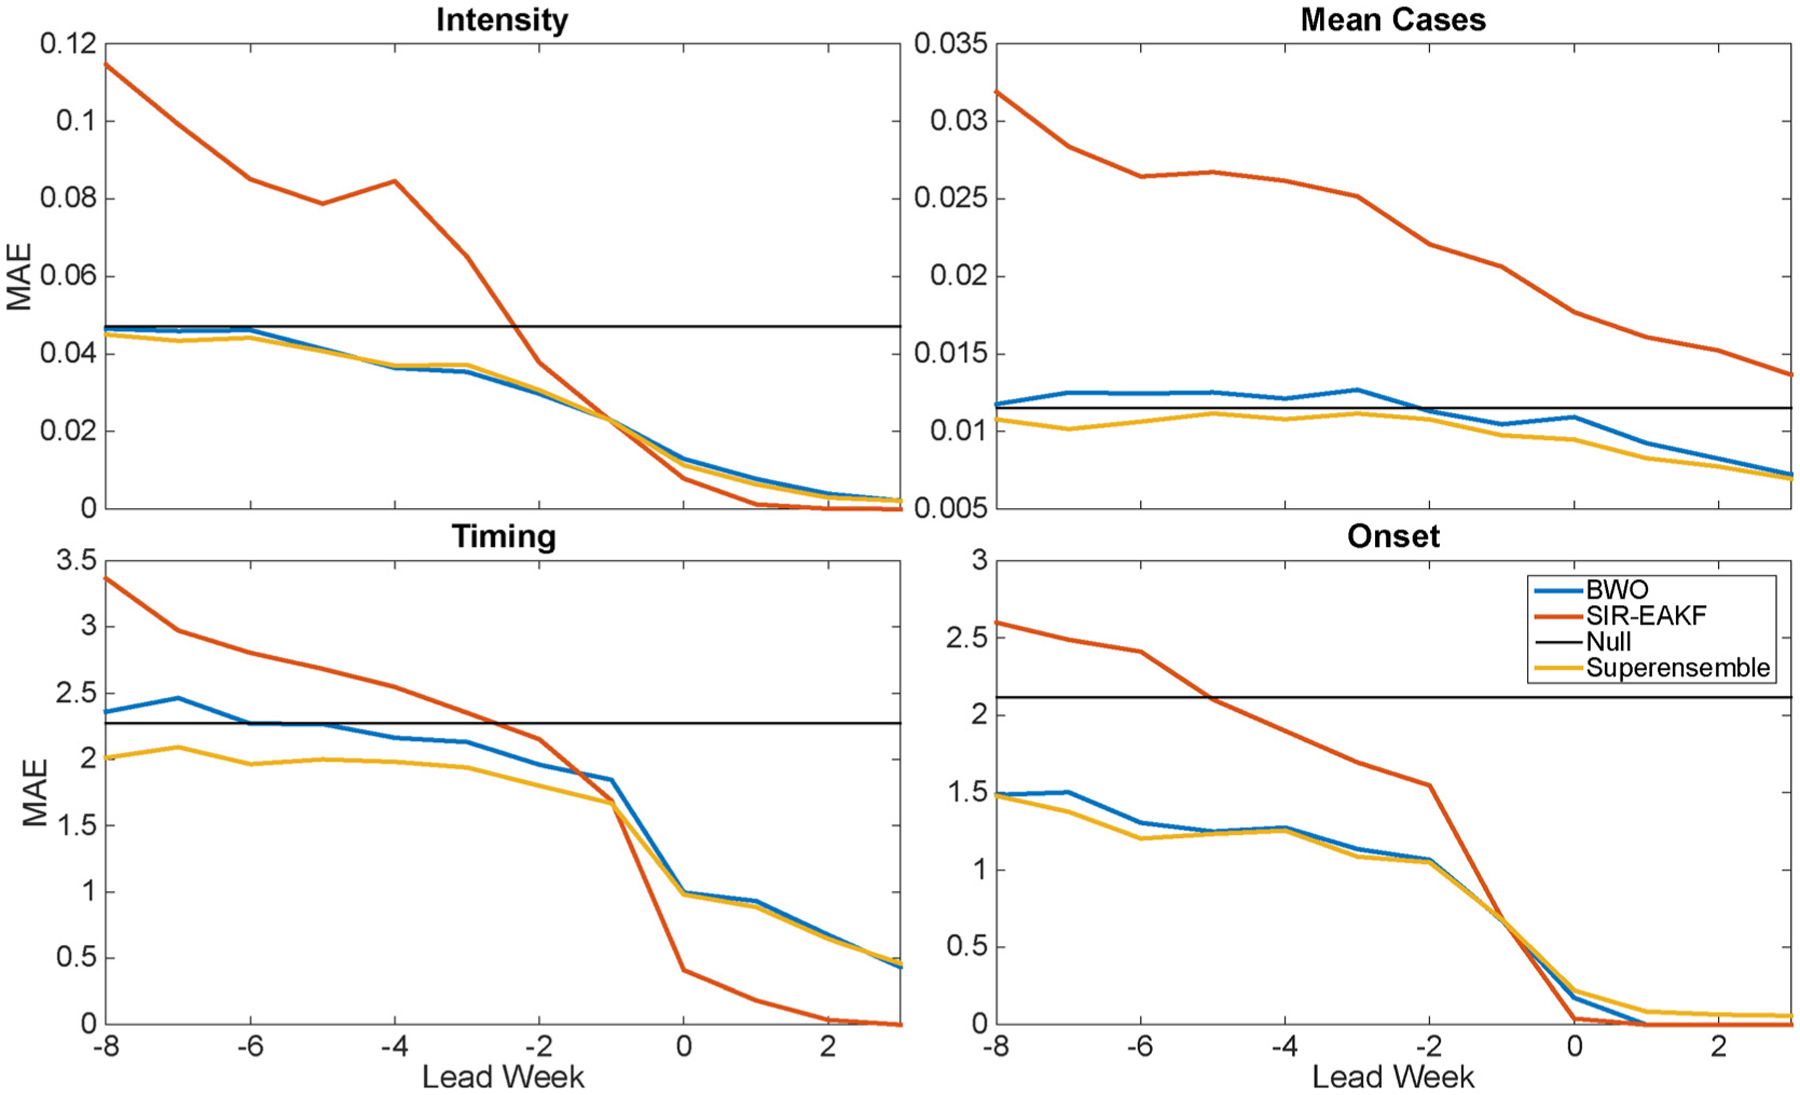
Fig. 2.

Mean absolute error (MAE) of RSV forecasts at the regional scale plotted as a function of actual lead week (forecast initiation week minus observed peak week for intensity, timing and total cases; forecast initiation week minus observed onset week for onset). The three models used to generate the superensemble are shown.
