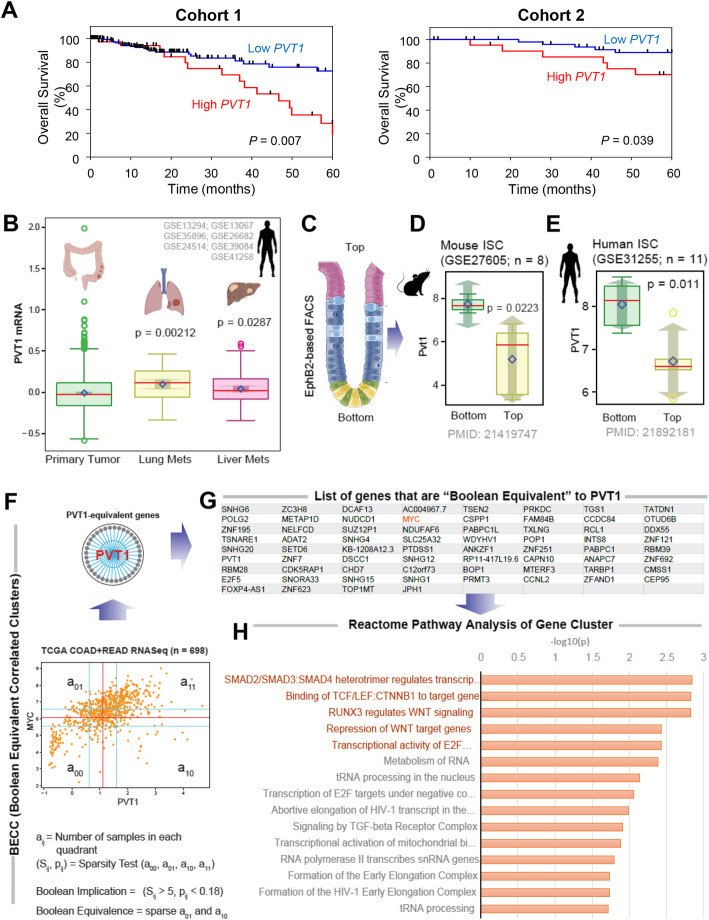
Fig. 2.
The PVT1 lncRNA is overexpressed in CRC. PVT1 lncRNA is highly expressed in CRC metastases and within crypt bases; is associated within gene clusters that regulate the TGFβ/SMAD2/3/4 and Wnt/β-Catenin pathways. a Overall Survival plot for patients with high-PVT1 lncRNA expression versus patients with low-PVT1 lncRNA expression in the two cohorts (P < 0.007 in Cohort-1, P < 0.039 in Cohort-2). b Whisker plots showing the levels of expression of PVT1 lncRNA in CRCs (primary and metastases) from 7 pooled datasets. c-e Schematic in C shows the EphB2-based FACS analyses approach used to separate epithelial cells at the bottom of the crypt from those at the top. Mouse (d) and human (e) datasets show whisker plots of the levels of expression of PVT1 lncRNA at the bottom and top of the crypts. f Computational approach to identify clusters of genes that share Boolean Equivalent relationships between each other, in this case identified using the PVT1 lncRNA as ‘seed’ in TCGA COAD dataset (n = 698) (top panel). Number of samples in all four quadrants are used to compute two parameters (S, p). S > 5 and p < 0.05 is used to identify sparse quadrant. Equivalent relationships are discovered when top-left and bottom-right quadrants are sparse (lower panel). g List of genes that are equivalent to the PVT1 lncRNA. MYC is highlighted in red. h Reactome pathway analysis shows pathways that are most prominently enriched (highlighted in red) in the PVT1-equivalent cluster

