
Figure 1.
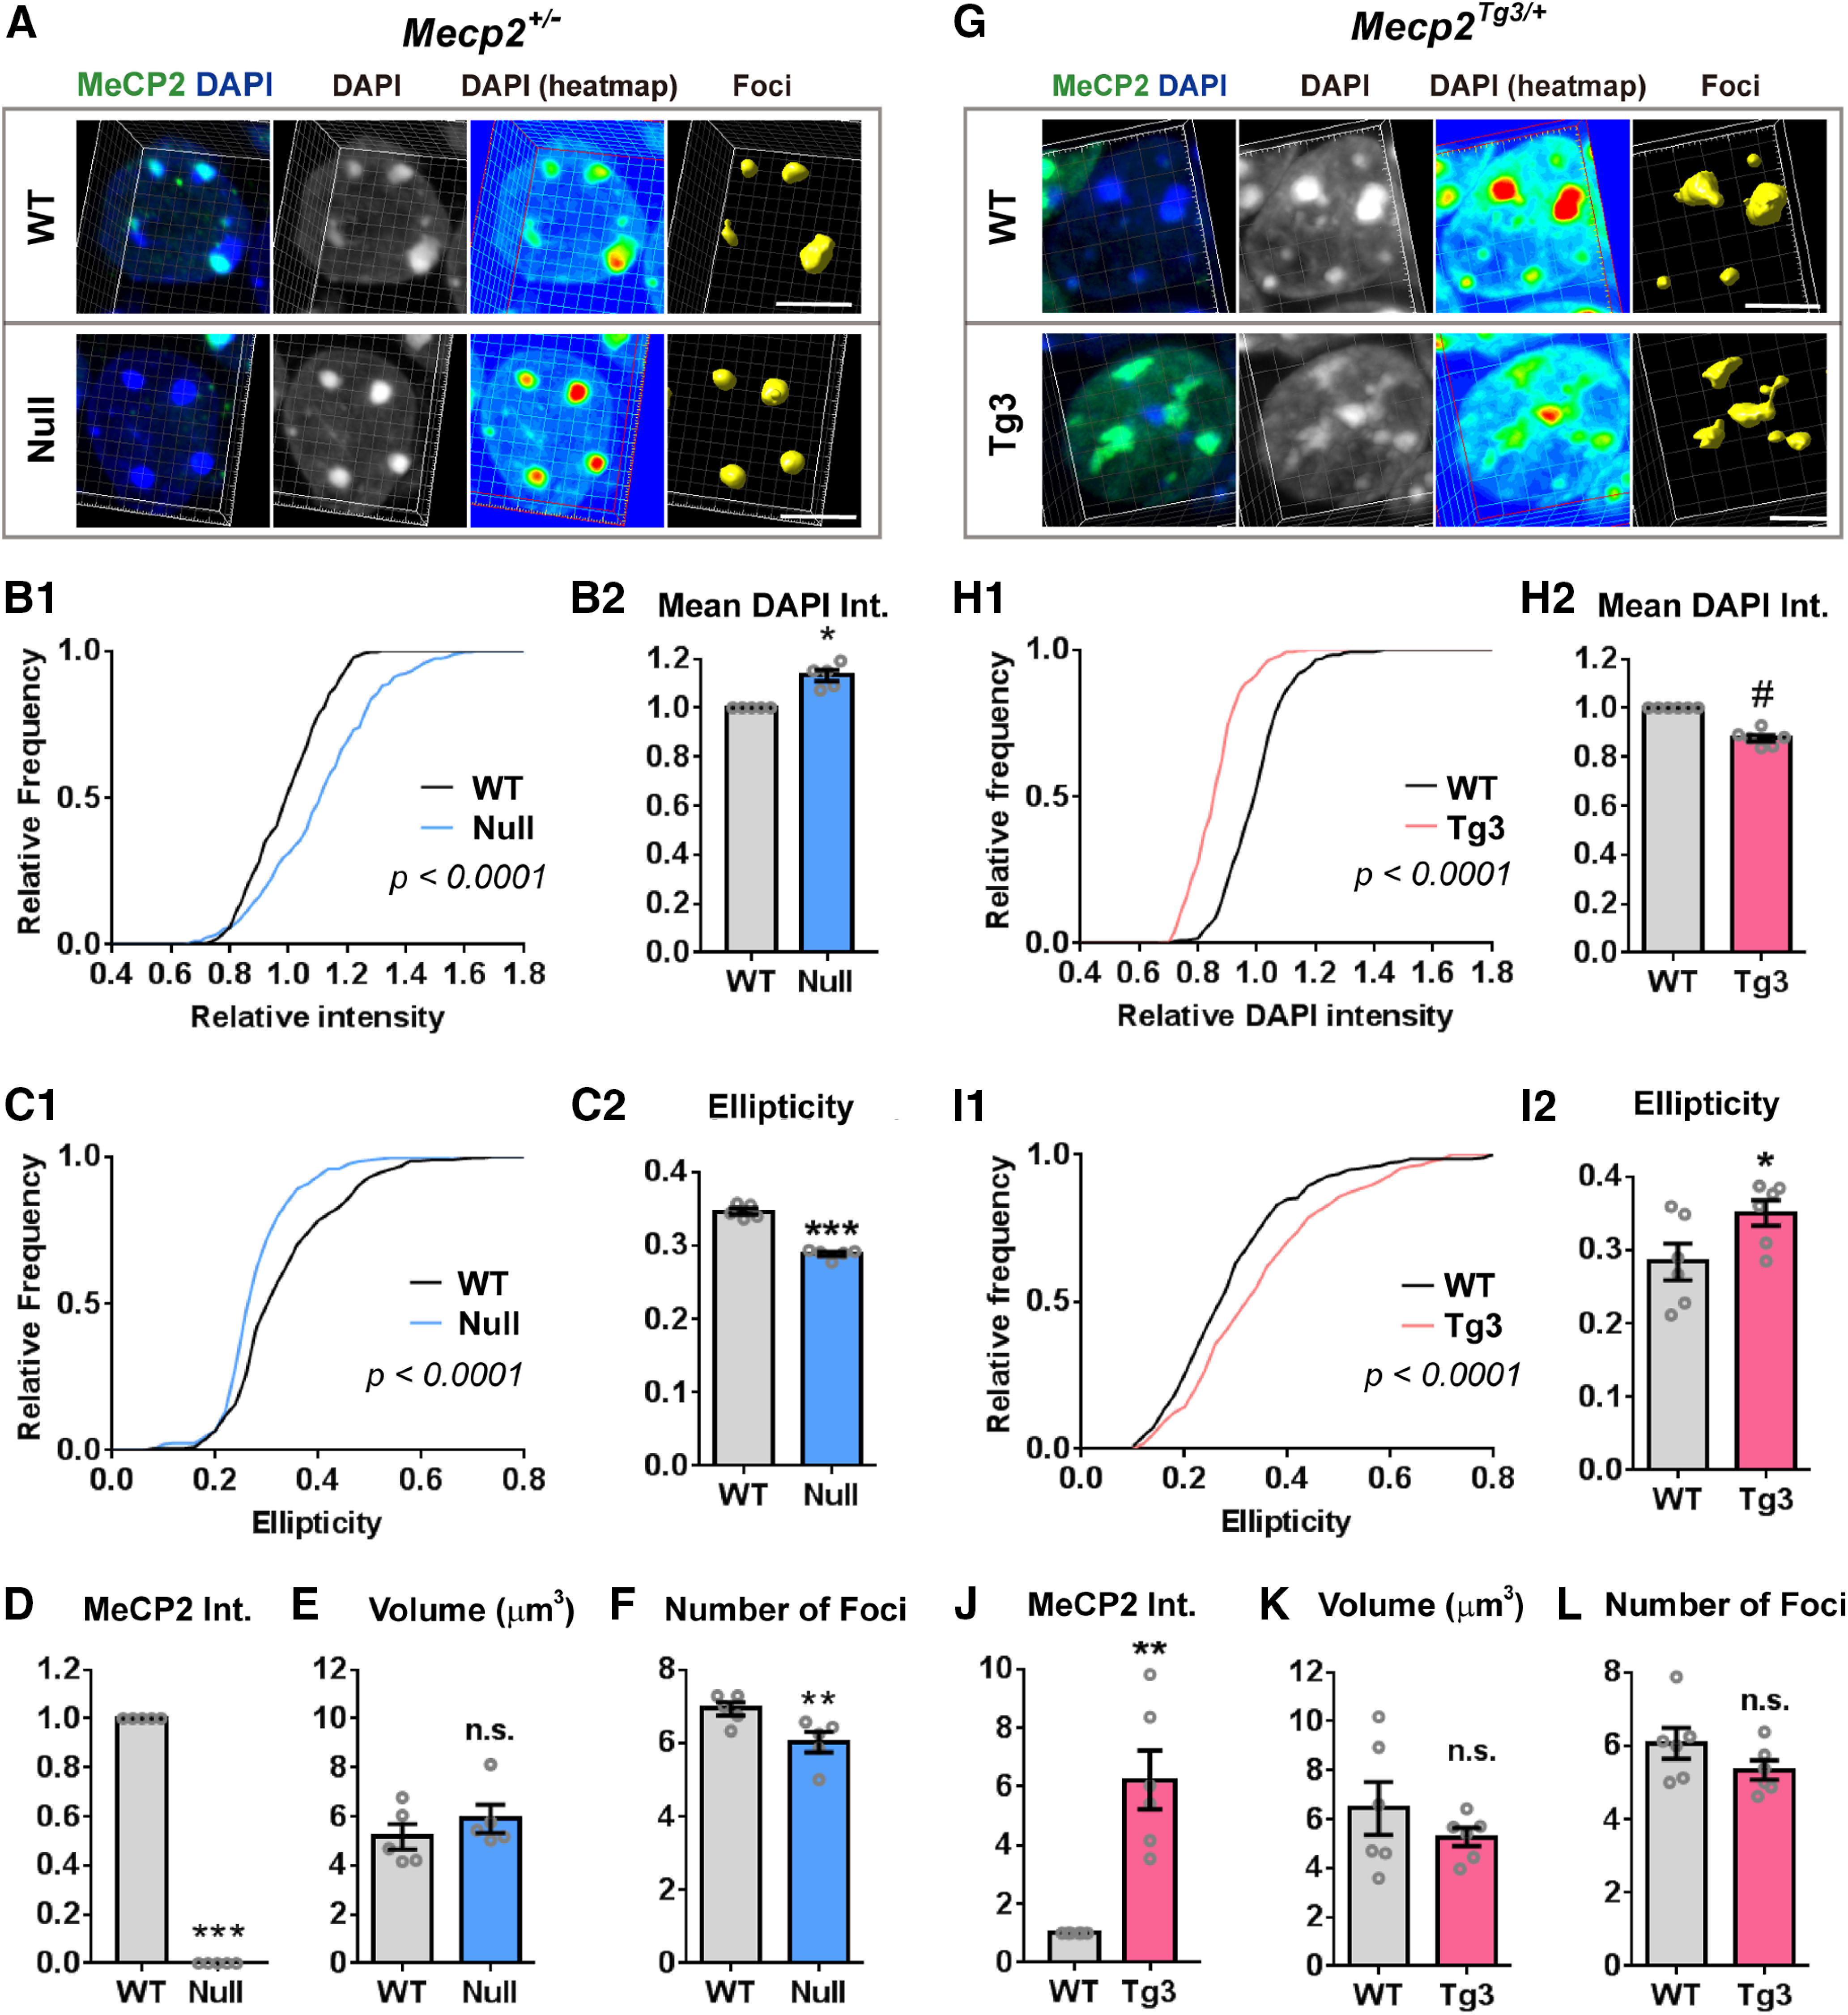
MeCP2 dosage regulates heterochromatic structure in CA1 pyramidal cells. A, CA1 pyramidal cells of Mecp2+/− female mice (three months old) were stained with DAPI (blue) and MeCP2 (green). 3D structure of the foci was constructed and analyzed by Imaris (yellow). Note the change in the DAPI intensity (heat map) and in the shape of foci in MeCP2-negative (Null) cells when compared with the MeCP2-positive (WT) cells. Scale bars: 5 µm. B–F, Results of the quantification from the images obtained in A. B, DAPI intensity (int.) in the heterochromatic foci was higher in Null-cells than in WT-cells. B1, Relative DAPI intensity of each focus was normalized to the mean DAPI intensity of the foci in WT-cell. The graph shows cumulative distribution of the normalized mean DAPI intensity. N = 271 foci from 5 mice (WT-cells) and 238 foci from 5 mice (Null-cells). Kolmogorov–Smirnov test; p < 0.0001. B2, Bar graph showing mean DAPI intensity averaged in each mouse. Mean DAPI intensity was higher in Null-cells. N = 5 mice. Two-tailed paired t test; p = 0.0162, t(4) = 3.995. C, Ellipticity in the foci was decreased in Null-cells. C1, Cumulative distribution of ellipticity in the foci was shifted toward left in Null-cells. N = 271 foci from 5 mice (WT-cells) and 238 foci from 5 mice (Null-cells). Kolmogorov–Smirnov test; p < 0.0001. C2, Bar graph showing ellipticity averaged across foci in each mouse. Ellipticity was lower in Null-cells than WT-cells. N = 5 mice. Two-tailed paired t test; p = 0.0008, t(4) = 9.137. D, Mean MeCP2 intensity was significantly reduced in Null-cells compared with WT-cells. N = 5 mice. Two-tailed paired t test; p = 0.0004, t(4) = 11.13. E, Average volume of heterochromatic foci was comparable between Null-cells and WT-cells. N = 5 mice, Two-tailed paired t test; p = 0.1848, t(4) = 1.6. F, Average number of heterochromatic foci per cell was reduced in Null-cells compared with WT-cells. N = 5 mice. Two-tailed paired t test; p = 0.0036, t(4) = 6.114. G, CA1 pyramidal cells of Mecp2Tg3/+ female mice (three months old) were stained and analyzed in the same way as in A. Scale bars: 5 µm. H–L, Quantified results from (G). Note the opposite changes in the parameters in Null-cells and Tg3-cells. H, DAPI intensity in the heterochromatic foci was reduced in Tg3-cells. H1, Relative DAPI intensity of each focus was normalized to the mean DAPI intensity of the foci in WT-cells. The graph shows cumulative distribution of the normalized mean DAPI intensity. N = 291 foci from 6 mice (WT-cells) and 256 foci from 6 mice (Tg3-cells). Kolmogorov–Smirnov test, p < 0.0001. H2, Bar graph showing mean DAPI intensity averaged in each mouse. Mean DAPI intensity was decreased in Tg3-cells. N = 6 mice. Two-tailed paired t test; p < 0.0001, t(5) = 16.92. I, Ellipticity in the foci was increased in Tg3-cells. I1, Cumulative distribution of ellipticity in each focus was shifted toward right in Tg3-cells. N = 291 foci from 6 mice (WT-cells) and 256 foci from 6 mice (Tg3-cells). Kolmogorov–Smirnov test; p < 0.0001. I2, Bar graph showing ellipticity averaged across foci in each mouse. Ellipticity was higher Tg3-cells than WT-cells. N = 6 mice. Two-tailed paired t test; p = 0.0422, t(5) = 2.711. J, Mean MeCP2 intensity (int.) was significantly higher in Tg3-cells than WT-cells. N = 6 mice. Two-tailed paired t test; p = 0.0037, t(5) = 5.114. K, Average volume of heterochromatic foci was comparable between Tg3-cells and WT-cells. N = 5 mice, Two-tailed paired t test; p = 0.2328, t(5) = 1.357. L, Average number of heterochromatic foci per cell was comparable between Tg3-cells and WT-cells. N = 5 mice. Two-tailed paired t test; p = 0.1478, t(5) = 1.711. Bars show average ± SEM; *p < 0.05, **p < 0.01, ***p < 0.001, # p < 0.0001; n.s., not significant.