Figure 12.
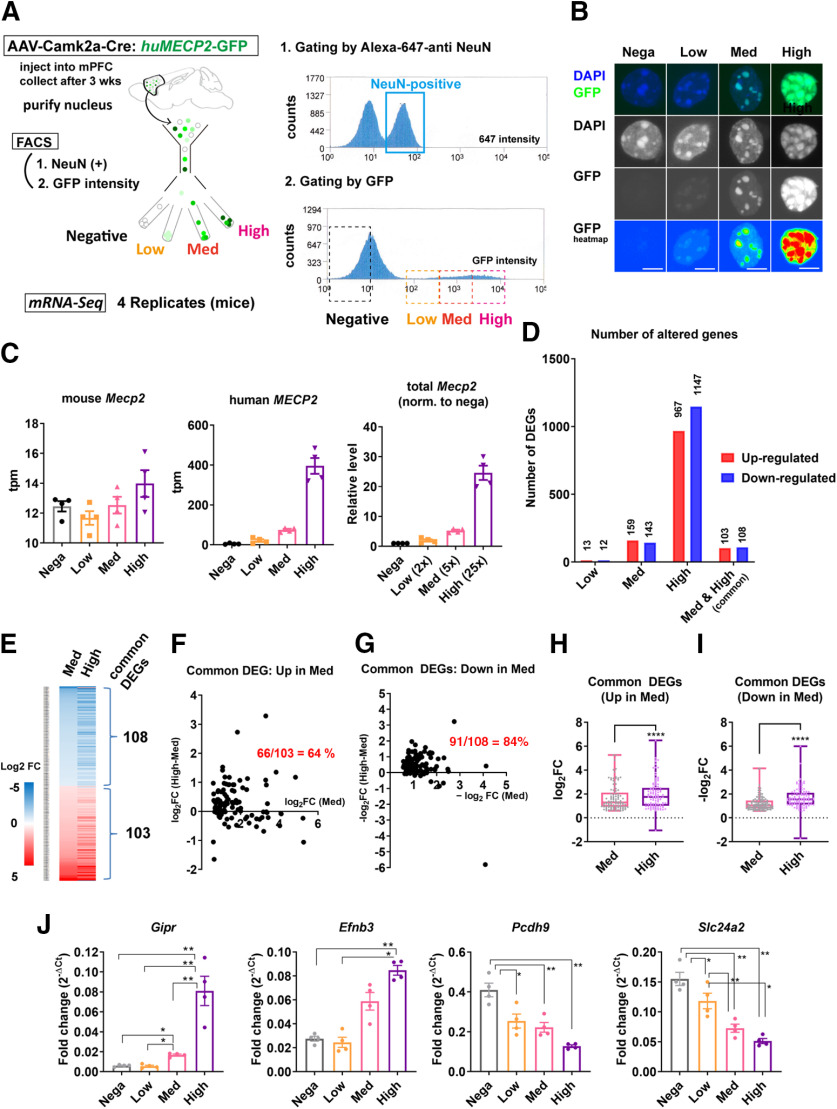
MeCP2 overexpression in the adult cortical neurons induces MeCP2 dosage-dependent transcriptional changes. A, Experimental design. AAV5-Camk2α-Cre and AAV(DJ)-DIO-huMECP2-GFP were used to induce overexpression of MeCP2 in the bilateral PFC of adult mice (six to seven weeks). PFC was dissected three weeks after the injection and neuronal nuclei labeled by anti-NeuN antibody were processed by FACS. The nuclei were sorted into four groups based on the GFP intensity and used for mRNA-Seq. Results from mRNA-Seq analysis including the number of mapped reads and the list of DEGs are summarized in Extended Data Figure 12-1. B, Images of the sorted nuclei. Scale bars: 5 µm. C–I, Results from mRNA-Seq analysis. DEGs were obtained using GFP-negative group as a control. C, Transcript levels of endogenous mouse Mecp2 (left), exogenous human MECP2 (middle), and total Mecp2 normalized to the control. Overexpression of human MECP2 did not cause significant changes in the endogenous mouse Mecp2 (left). Total Mecp2 reads correlated positively with the GFP expression levels. D, Number of DEGs in GFP-low, GFP-med, and GFP-high groups. Higher numbers of DEGs were detected with higher expression of MECP2. E, Heatmap showing log2FC for genes altered in both GFP-med and GFP-high groups. Absolute log2FC in GFP-high group was consistently higher than that in GFP-med group. F, G, Difference in the absolute log2FC between GFP-med and GFP-high groups were plotted in y-axis and the absolute log2FC for each gene in GFP-med group were plotted in x-axis. Values in y-axis were higher than zero in the majority of common DEGs in both upregulated genes (F) and downregulated genes (G). The fractions of these genes are indicated in red. H, I, Comparison of log2FC for common DEGs between GFP-med and GFP-high groups. The analysis was done in both upregulated genes (H) and downregulated genes (I). The results show that the absolute log2FC for each gene is consistently higher in GFP-high group than in GFP-med group. Wilcoxon matched pair signed rank test. p < 0.0001, N = 103 genes (H); p < 0.0001, N = 108 genes (I). J, Results from RT-qPCR for the subset of common DEGs with the most significant FDRs. Fold change was obtained by normalizing Ct of each gene with that of Gapdh. The magnitude of fold change was consistently higher in GFP-high group and clearly correlated with MECP2 expression levels. One-way ANOVA: p < 0.0001, F(2.427,7.281) = 106.1 (Gipr), p = 0.0011, F(1.971,5.912) = 27.24 (Efnb3), p = 0.0031, F(1.299,3.897) = 39.50 (Pcdh9), p = 0.0025, F(1.265,3.796) = 47.24 (Slc24a2). ANOVA was followed by post hoc Tukey's multiple comparison tests. Gipr: p = 0.0121 (negative vs med), p = 0.0036 (negative vs high), p = 0.0128 (low vs med), p = 0.0021 (low vs high), p = 0.0067 (med vs high). Efnb3: p = 0.0075 (negative vs high) and 0.0164 (low vs high). Pcdh9: p = 0.0239 (negative vs low), 0.0021 (negative vs med), and 0.0074 (negative vs high). Slc24a2: p = 0.0427 (negative vs low), p = 0.0014 (negative vs med), p = 0.0099 (negative vs high), p = 0.0016 (low vs med), and p = 0.0309 (low vs high). Bar graphs show average ± SEM; *p < 0.05, **p < 0.001, ****p < 0.0001.

