Figure 2.

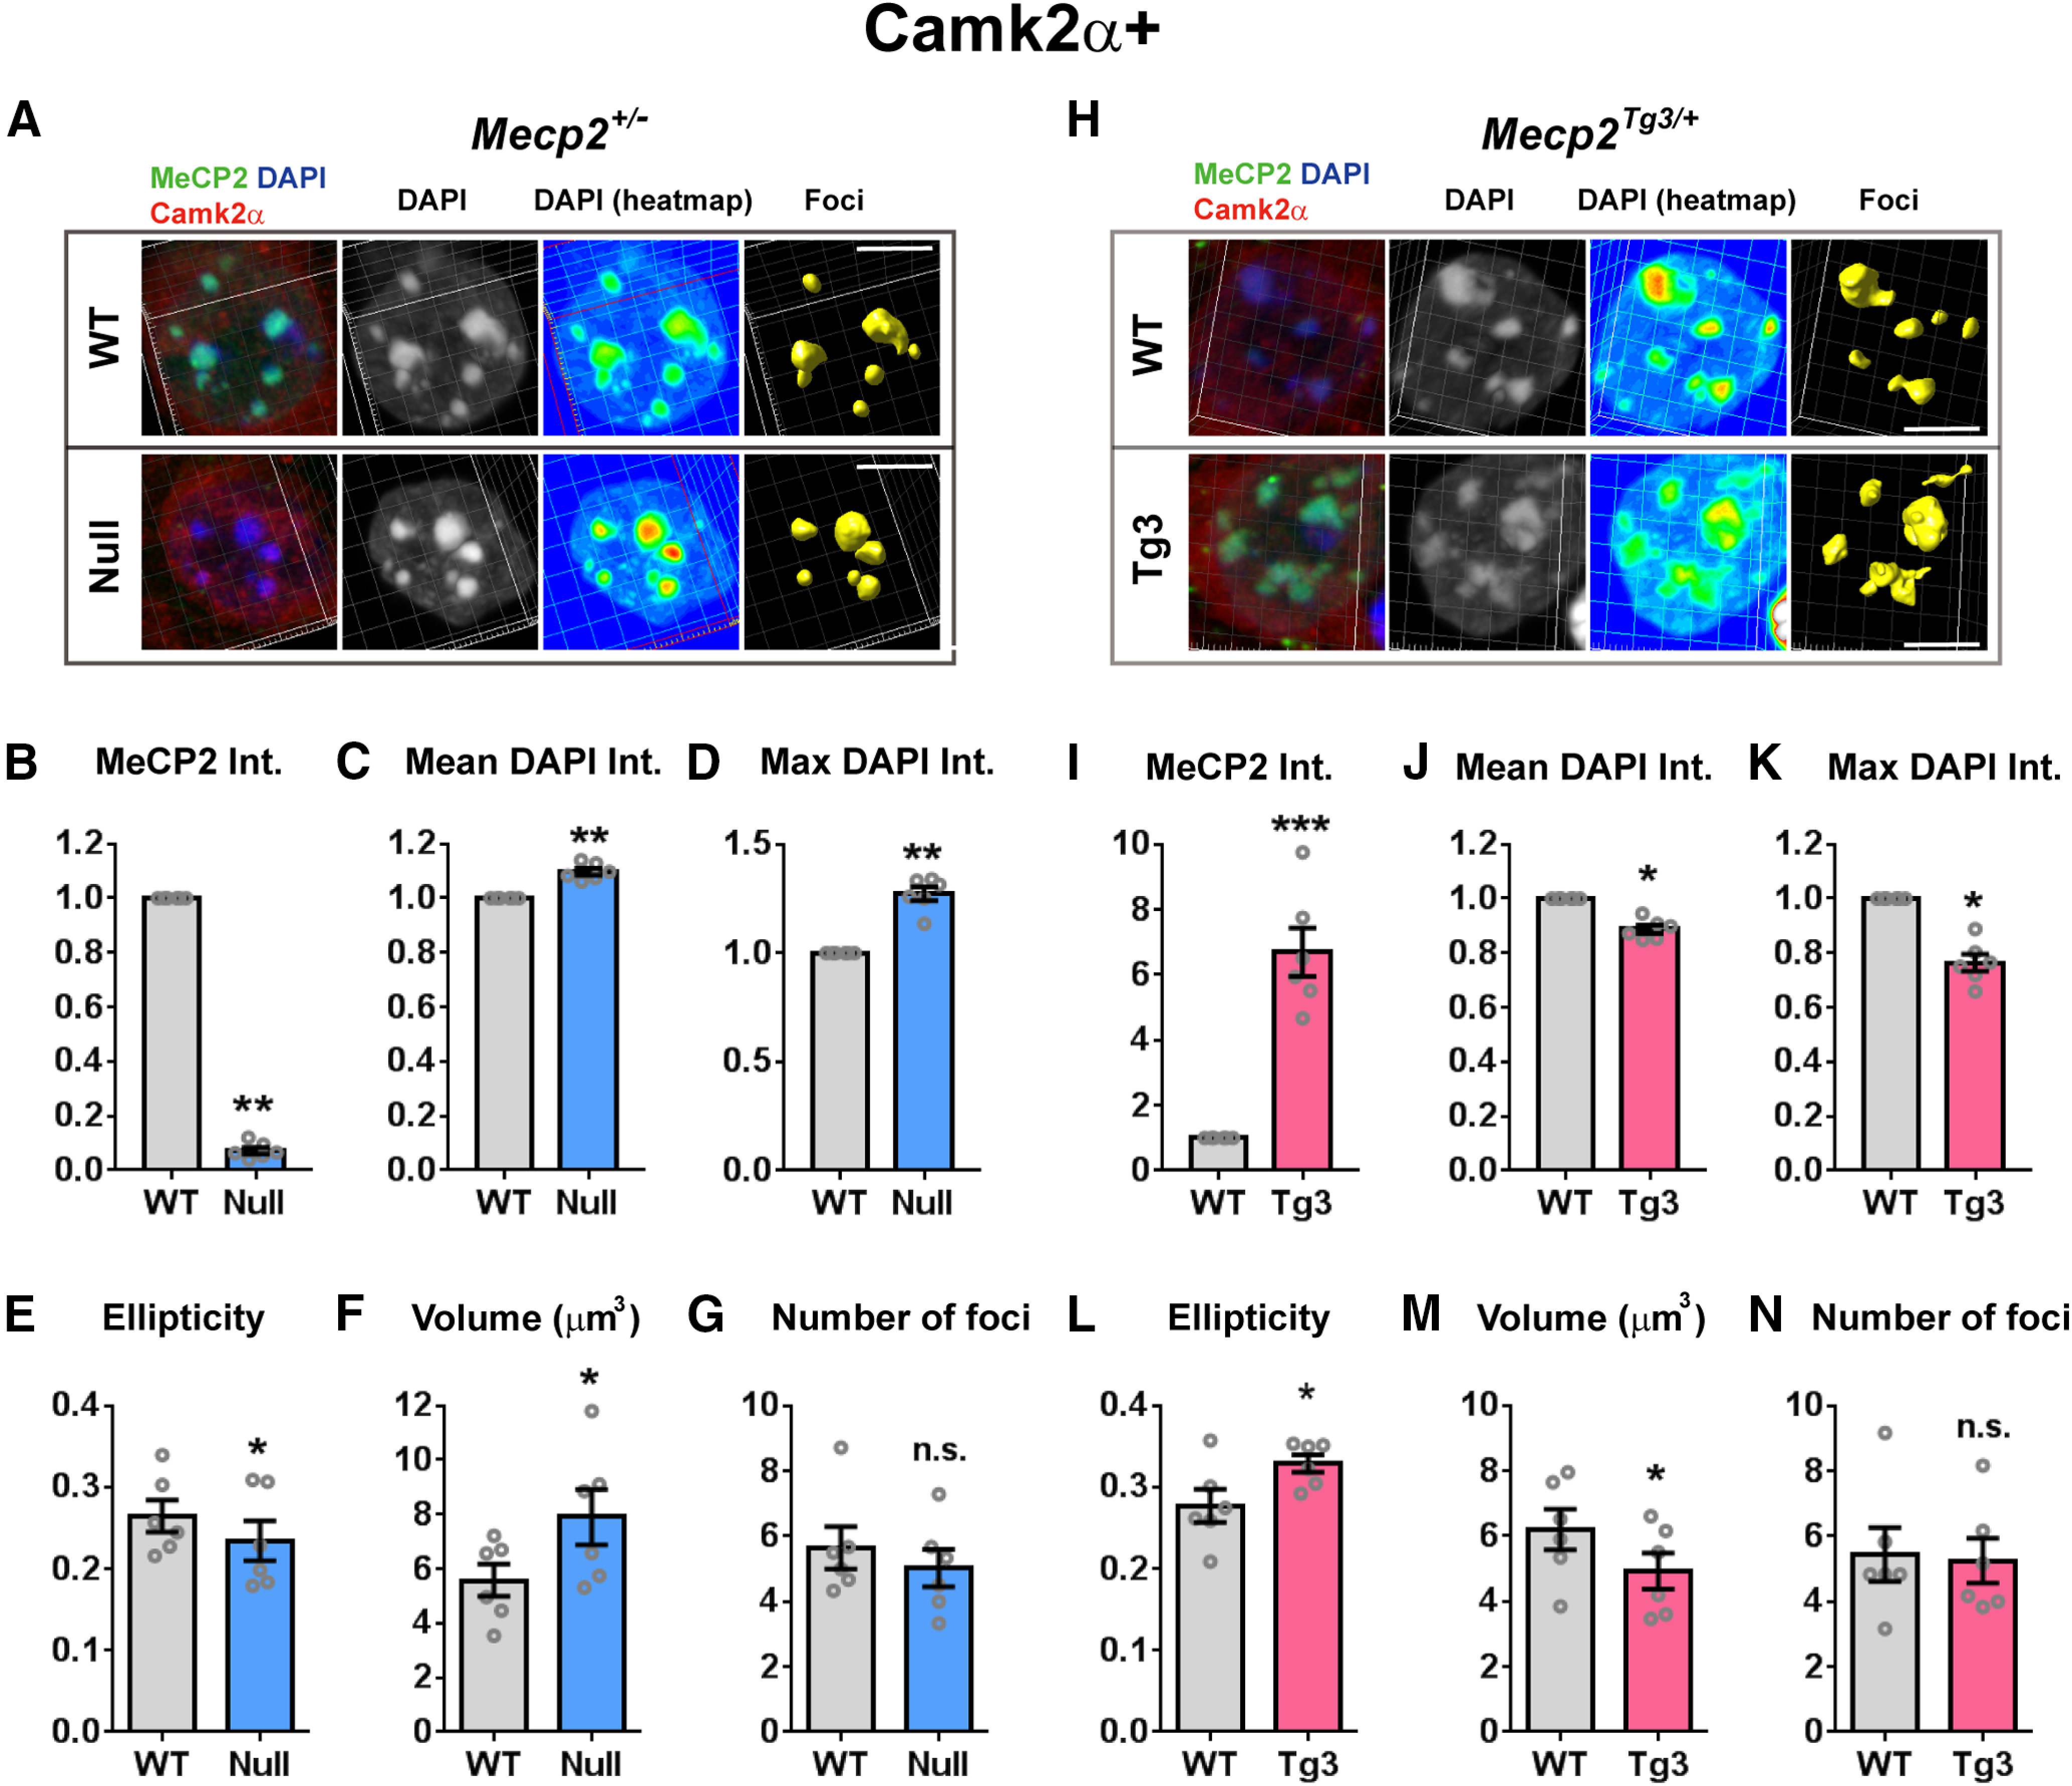
Impact of MeCP2 dosage on the heterochromatin structure of cortical excitatory cells. A, DAPI-foci in the cortical excitatory neurons of Mecp2+/− female mice (three months old). Neurons were stained for MeCP2 (green), DAPI (blue), and Camk2α (red). WT-cells and Null-cells were analyzed using the same method as in Figure 1. Scale bars: 5 µm. B–G, Quantified results from A. N = 6 mice. Two-tailed paired t test. B, Mean MeCP2 intensity (int.) was significantly reduced in Null-cells. p = 0.0032, t(5) = 5.299. C, Mean DAPI intensity was significantly increased in Null-cells. p = 0.0023, t(5) = 5.708. D, Maximum DAPI intensity within the heterochromatic foci was increased in Null-cells. p = 0.0016, t(5) = 6.157. E, Ellipticity of the heterochromatic foci was decreased in Null-cells. p = 0.0205, t(5) = 3.343. F, Average volume of foci was higher in Null-cells than in WT-cells. p = 0.0113, t(5) = 3.906. G, Average number of foci per nucleus was comparable between Null-cells and WT-cells. p = 0.0577, t(5) = 2.453. H, Heterochromatic foci in the cortical excitatory neurons of Mecp2Tg3/+ female mice (three months old). Neurons were stained for MeCP2 (green), DAPI (blue), and Camk2α (red). Scale bars: 5 µm. I–N, Quantified results from H. N = 6 mice. Two-tailed paired t test. I, Mean MeCP2 intensity was significantly increased in Tg3-cells. p = 0.0009, t(5) = 6.955. J, Mean DAPI intensity was significantly decreased in Tg3-cells. p = 0.0137, t(5) = 3.721. K, Maximum DAPI intensity within the heterochromatic foci was decreased in Tg3-cells. p = 0.0137, t(5) = 3.721. L, Ellipticity of the heterochromatic foci was increased in Tg3-cells. p = 0.0153, t(5) = 3.613. M, Average volume of foci was lower in Tg3-cells than in WT-cells. p = 0.0181, t(5) = 3.457. N, Average number of foci per nucleus was comparable between Tg3-cells and WT-cells. p = 0.5365, t(5) = 0.6632. Bars show average ± SEM; *p < 0.05, **p < 0.01, ***p < 0.001; n.s., not significant.
