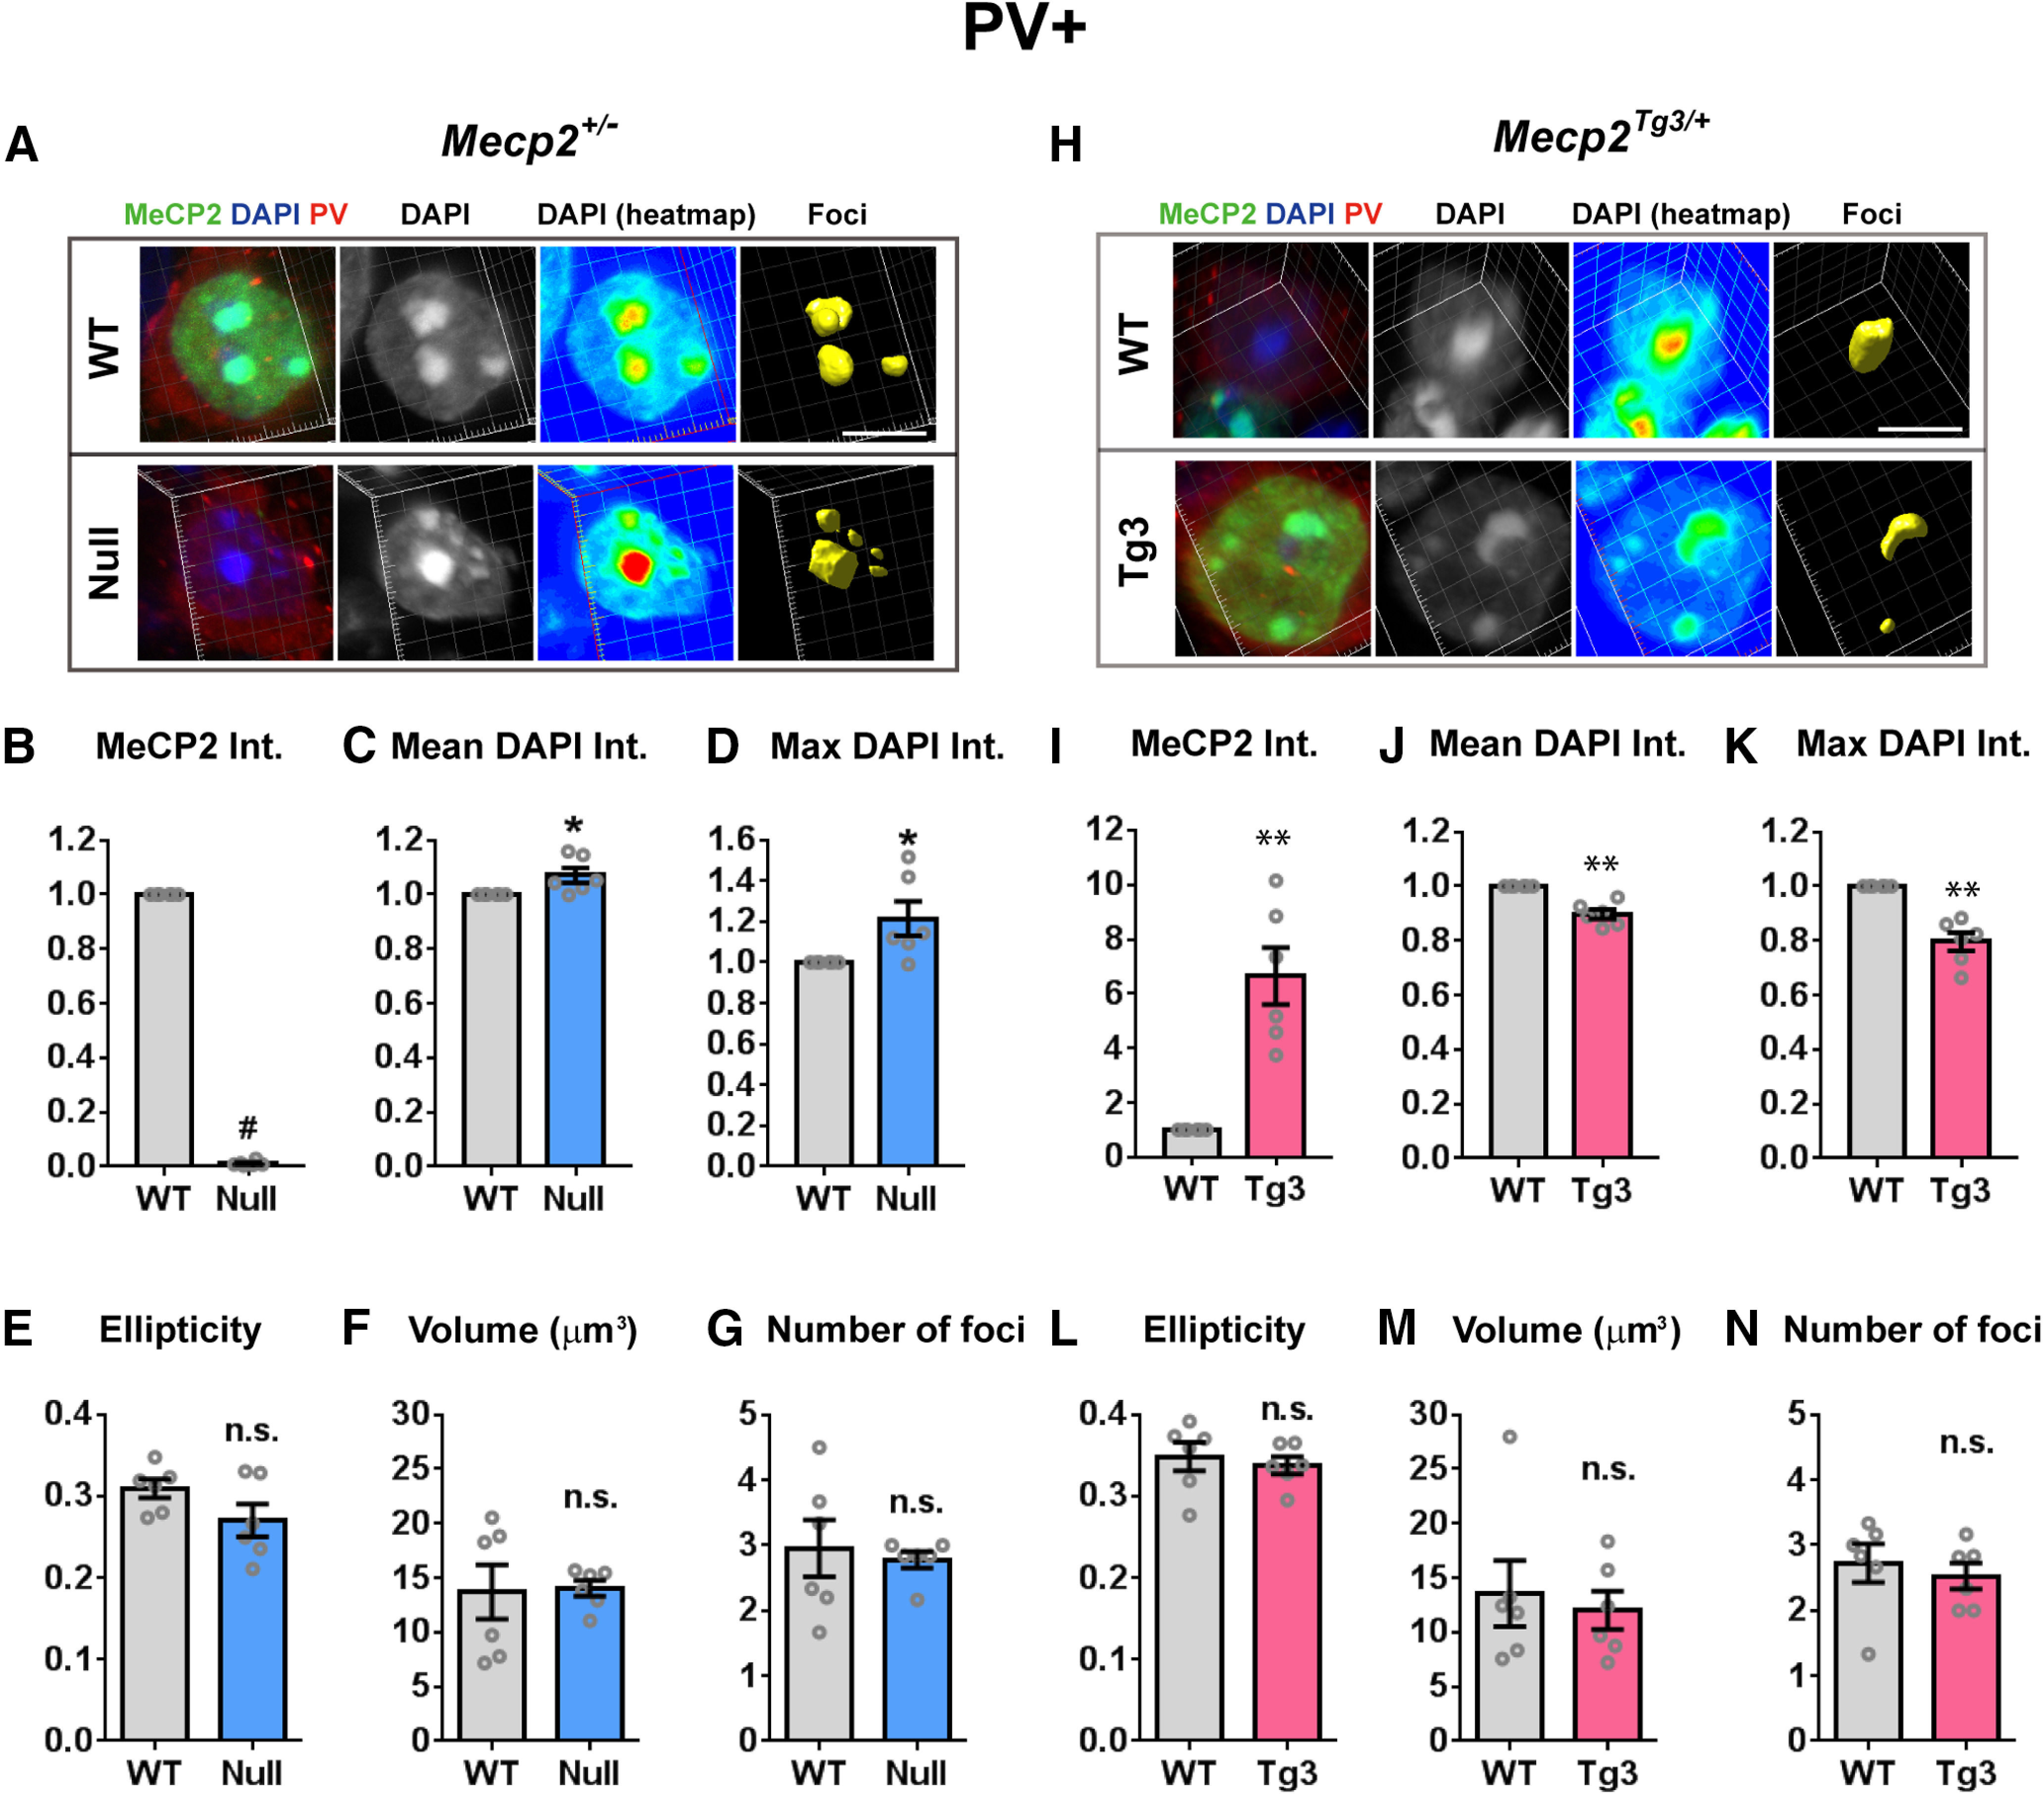
Figure 3.

MeCP2-dependent structural changes of the heterochromatic foci in the cortical inhibitory neurons. A, DAPI-foci in the cortical PV-positive inhibitory neurons of Mecp2+/− female mice (three months old). Neurons were stained for MeCP2 (green), DAPI (blue), and PV (red). The images were analyzed using the same method as in Figures 1, 2. Scale bars: 5 µm. B–G, Quantified results from A. N = 6 mice. Two-tailed paired t test. B, Mean MeCP2 intensity (int.) was significantly reduced in Null-cells. p = 0.0006, t(5) = 7.771. C, Mean DAPI intensity was significantly increased in Null-cells. p = 0.0355, t(5) = 2.857. D, Maximum DAPI intensity within the heterochromatic foci was increased in Null-cells. p = 0.0474, t(5) = 2.615. E, Ellipticity of the heterochromatic foci was comparable between Null-cells and WT-cells. p = 0.1119, t(5) = 1.927. F, Average volume of foci was not changed in Null-cells. p = 0.9172, t(5) = 0.1093. G, Average number of foci per nucleus was comparable between Null-cells and WT-cells. p = 0.6920, t(5) = 0.42. H, DAPI-foci in the cortical PV-positive inhibitory neurons of Mecp2Tg3/ female mice (three months old). Scale bars: 5 µm. I–N, Quantified results from H. N = 6 mice. Two-tailed paired t test. I, Mean MeCP2 intensity was significantly higher in Tg3-cells. p = 0.0096, t(5) = 4.071. J, Mean DAPI intensity was significantly reduced in Tg3-cells. p = 0.0064, t(5) = 4.494. K, Maximum DAPI intensity within the heterochromatic foci was decreased in Tg3-cells. p = 0.0066, t(5) = 4.464. L, Ellipticity of the heterochromatic foci was comparable between Tg3-cells and WT-cells. p = 0.4481, t(5) = 0.8228. M, Average volume of foci was not changed in Tg3-cells. p = 0.5838, t(5) = 0.5853. N, Average number of foci per nucleus was comparable between Tg3-cells and WT-cells. p = 0.5219, t(5) = 0.6883. Bar graphs show average ± SEM; *p < 0.05, **p < 0.01, # p < 0.0001; n.s., not significant.
