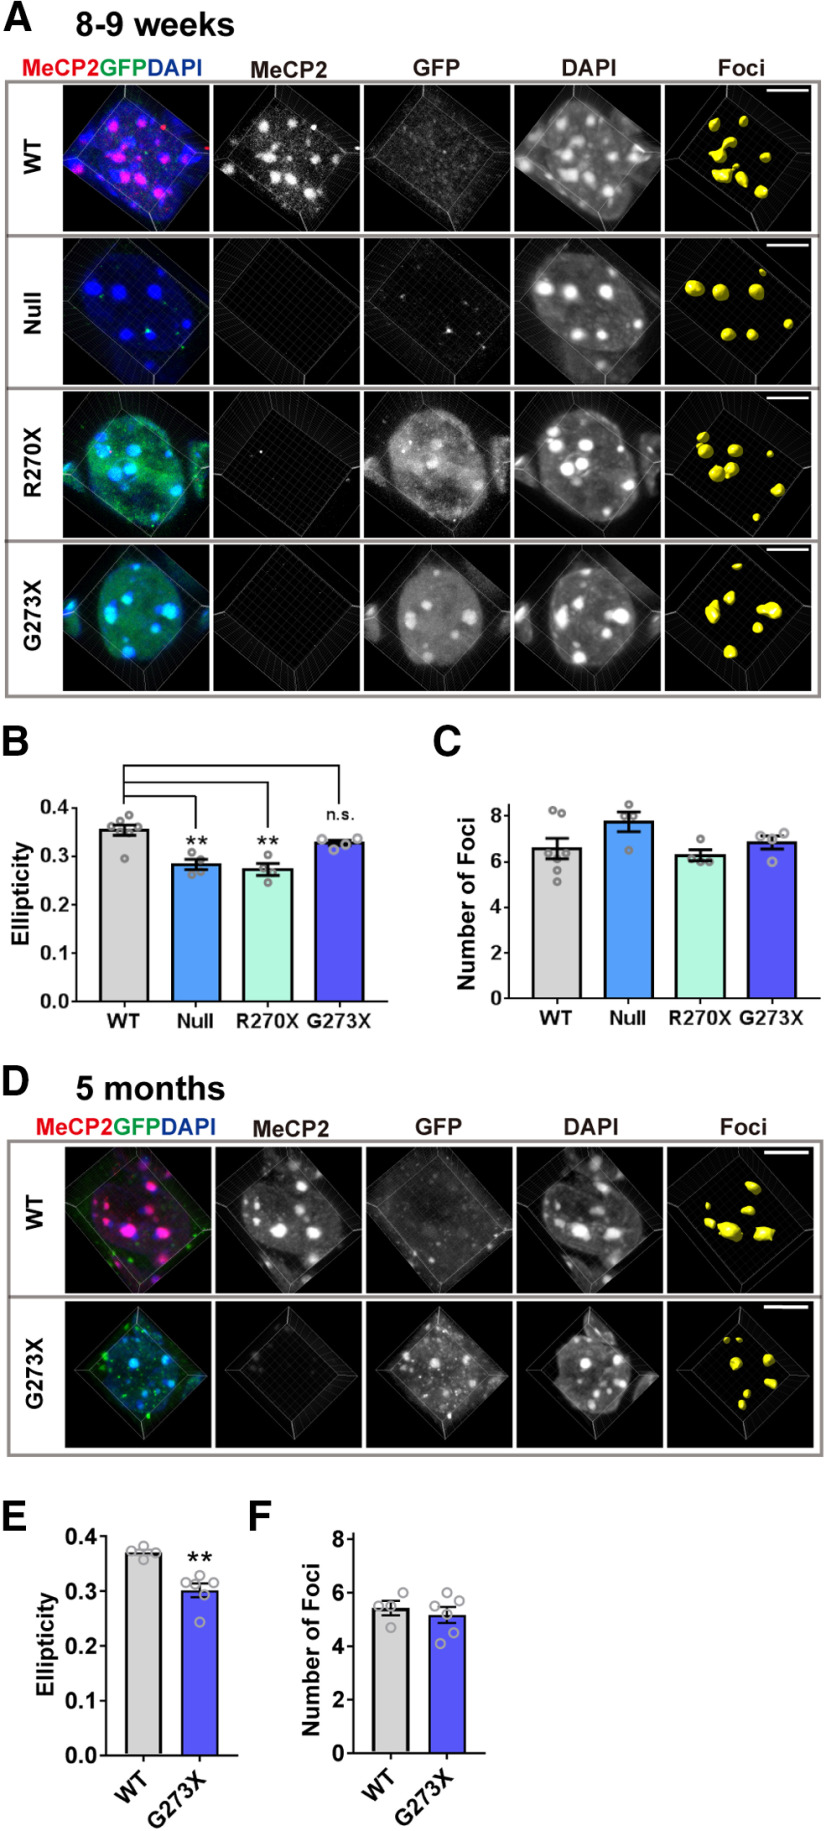
Figure 8.
AT-hook 2 domain of MeCP2 influences onset of heterochromatic structural changes in CA1 pyramidal cells. A, Representative images of heterochromatic foci in CA1 pyramidal cells obtained from eight- to nine-week-old WT (Mecp2+/y, WT), Mecp2–/y (Null), Mecp2–/y;MECP2-R270X (R270X), and Mecp2–/y; MECP2-G273X (G273X) mice. The cells were stained with anti-GFP to confirm expression of mutant MeCP2 which were tagged with GFP, and anti-MeCP2 C terminus antibody to confirm depletion of endogenous MeCP2. Scale bars: 5 µm. B, C, Quantitative results from the images in A. N = 7 (WT), N = 4 (Null), N = 4 (R270X), and N = 4 mice (G273X). One-way ANOVA followed by Tukey's multiple comparison test. B, Ellipticity of the heterochromatic foci was decreased in Mecp2-null mice and in mice expressing MeCP2-R270X, while it was not changed in mice expressing MeCP2-G273X. One-way ANOVA, p = 0.0002, F(3,15) = 13.27. Tukey's multiple comparison tests; p = 0.0013 (WT vs Null), 0.0003 (WT vs R270X), and 0.3267 (WT vs G273X). C, Average number of heterochromatic foci per cell was comparable in all the genotypes analyzed. One-way ANOVA, p = 0.1523, F(3,15) = 2.034. D, Heterochromatic foci in the CA1 pyramidal cells of five-month-old G273X and WT mice. E, Ellipticity of the heterochromatic foci was decreased in five-month-old G273X mice. N = 4 (WT) and N = 6 (G273X) mice. Two-tailed t test. p = 0.0026, t(8) = 4.298. F, Average number of heterochromatic foci per cell was not altered. N = 4 (WT) and N = 6 (G273X) mice. Mann–Whitney U test. p = 0.6619. Bar graphs show average ± SEM; **p < 0.01; n.s., not significant.

